Originally published May 26, 2026. Last updated September 18, 2026 with 2025 and 2026 data from Datos Insights, LexisNexis Risk Solutions, MRC, and Mastercard, a new section on measuring false positive rate, and a structural breakdown of why fraud tools misfire at scale.
False positives in fraud detection are legitimate orders that a fraud tool flags or declines as fraud. The customer is real, the card is theirs, and the intent is to buy; the system still says no. Every rules engine, risk model, and identity check produces some false positives, because each one is judging a person from a partial view of a transaction. The question for a risk or fraud leader is not whether false positives exist, but how many, why, and what the tool is doing about them.
This post is about the mechanics: why rules engines, single-transaction models, identity-only signals, static thresholds, and plain volume growth generate false positives, how to measure the false positive rate in a way the business can act on, and how to bring it down without opening a wider door to fraud. For the customer side of the same problem, what a wrongly declined shopper experiences and what it costs the relationship, see our companion piece on what false declines are and how to prevent them.
What Is a False Positive in Fraud Detection?
In fraud detection, “positive” means the system predicted fraud. A false positive is a positive prediction that turned out to be wrong: the order was good. Its mirror is the false negative, a fraudulent order that got through. Every fraud tool trades one against the other. Tighten the rules and false negatives fall while false positives rise; loosen them and the reverse happens.
The trade is not symmetric in how it shows up. A false negative becomes a chargeback with a reason code, a fee, and a line in a monthly report. A false positive becomes an order that never existed. Nobody disputes a sale they were not allowed to make, which is why fraud programs have historically optimized against the loss they can see and tolerated the one they cannot.
How Much Do False Positives Cost?
More than the fraud the tools exist to stop, and the cost compounds with growth.
Datos Insights’ May 2026 report on reducing unnecessary declines in card payments puts US false declines at US$213 billion a year as of 2025, on track for US$297 billion by 2029. That figure sits on the issuer side, where the bank makes the call. Merchant-side fraud tools add their own layer of declines on top, and a good customer can be turned away at either point. For comparison, MRC’s 2026 Global Payments and Fraud Report puts global ecommerce revenue lost to payment fraud at 3.2% of total annual ecommerce revenue. Fraud is a real cost. The revenue turned away in the name of stopping it is a bigger one.
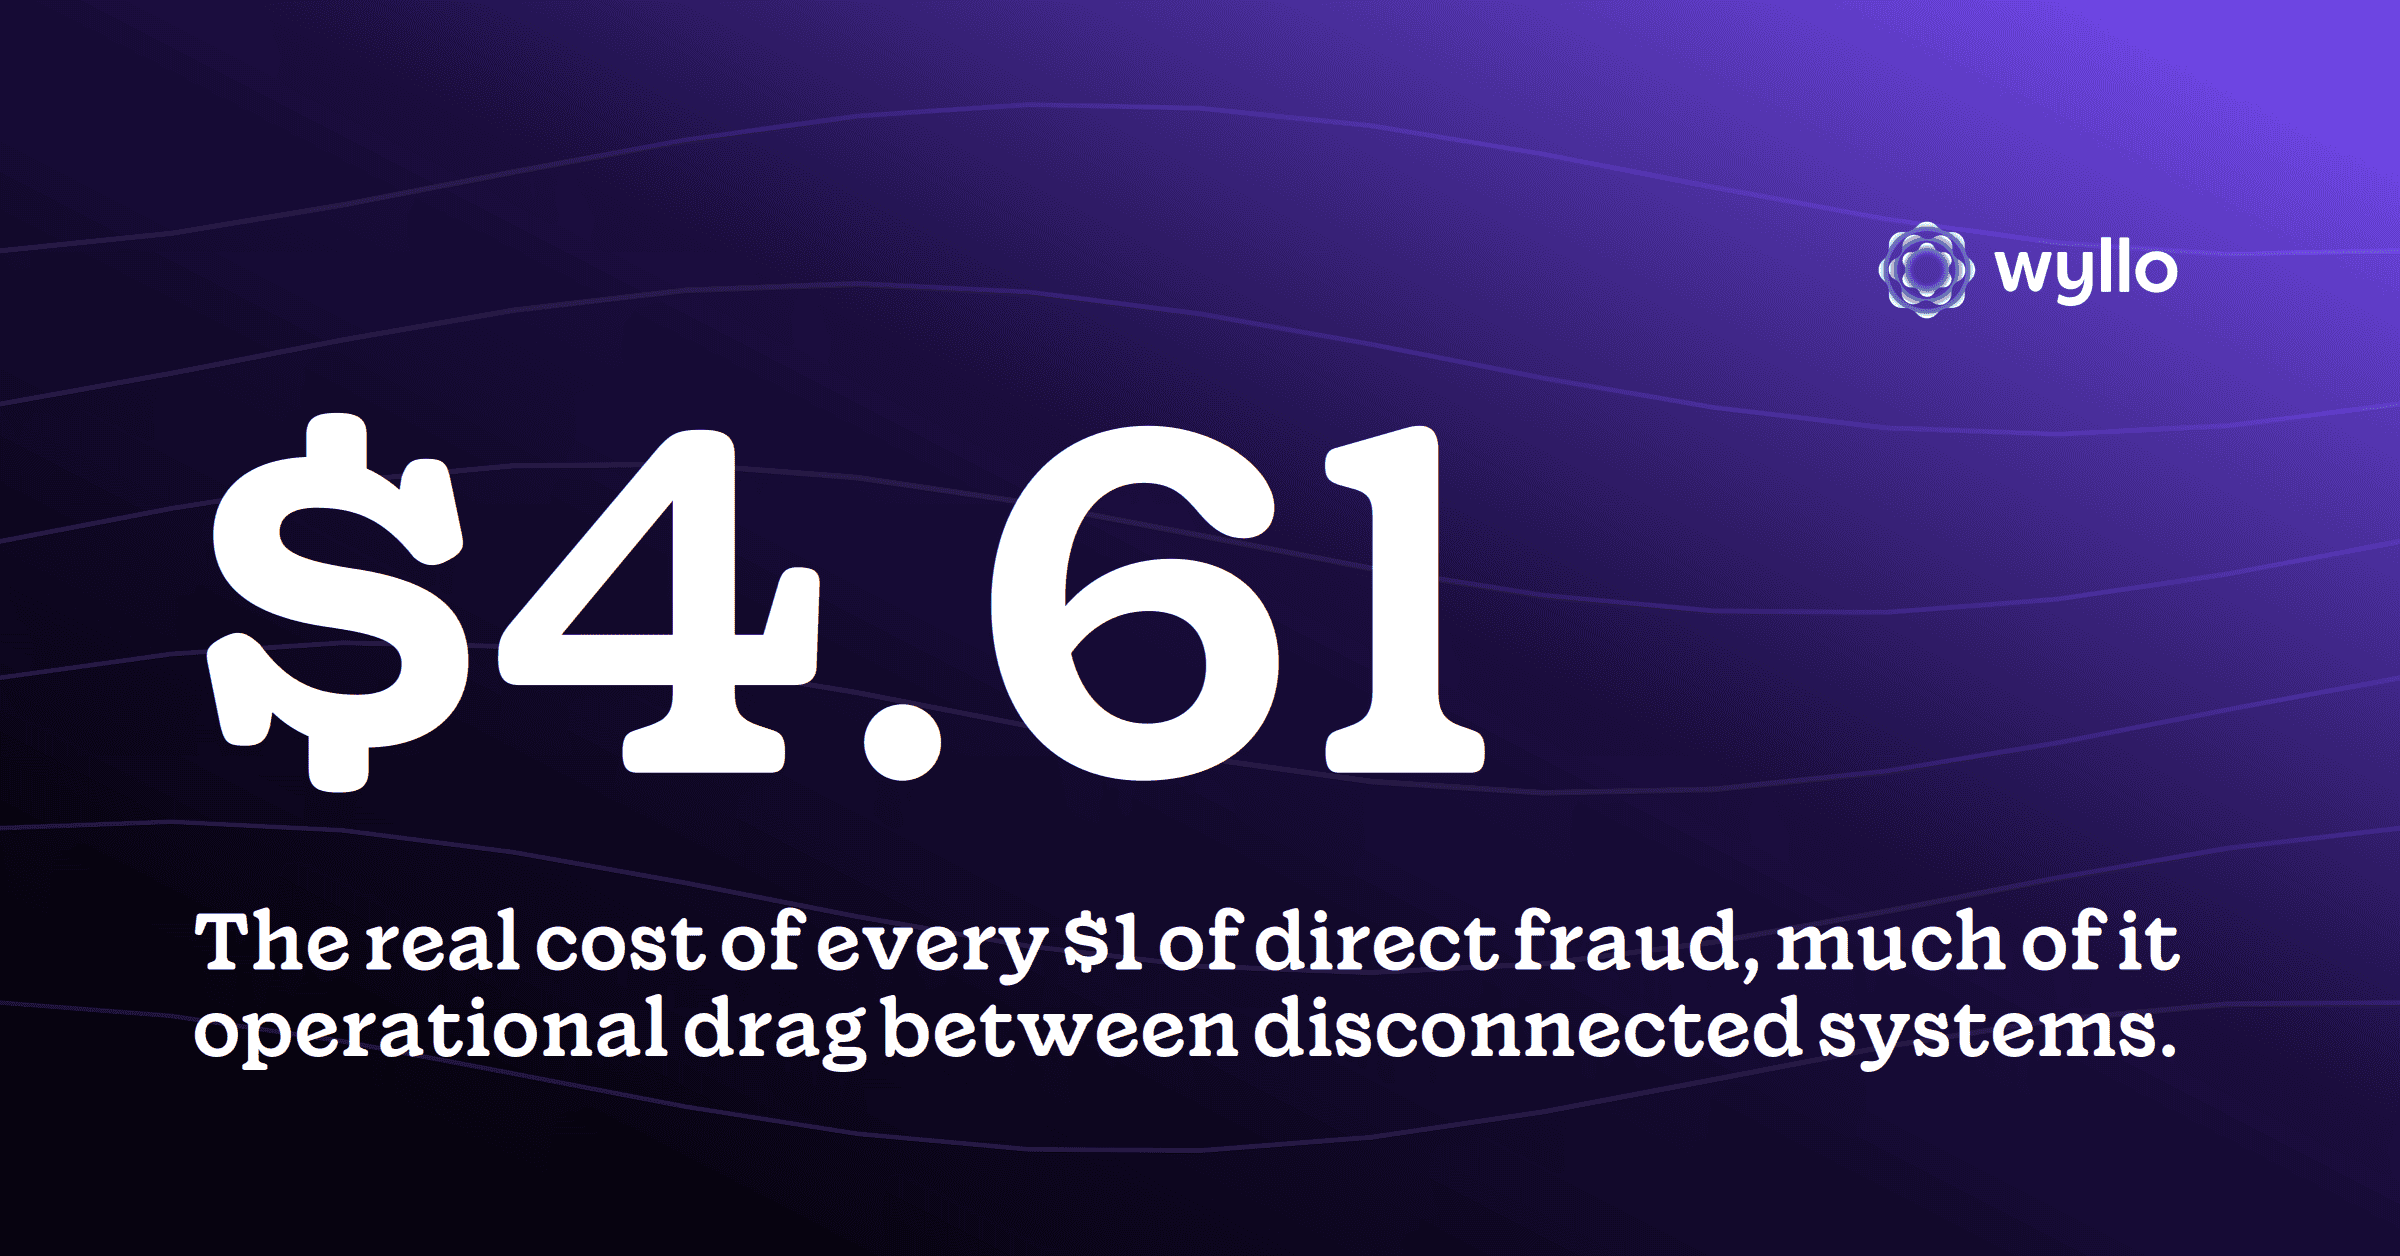
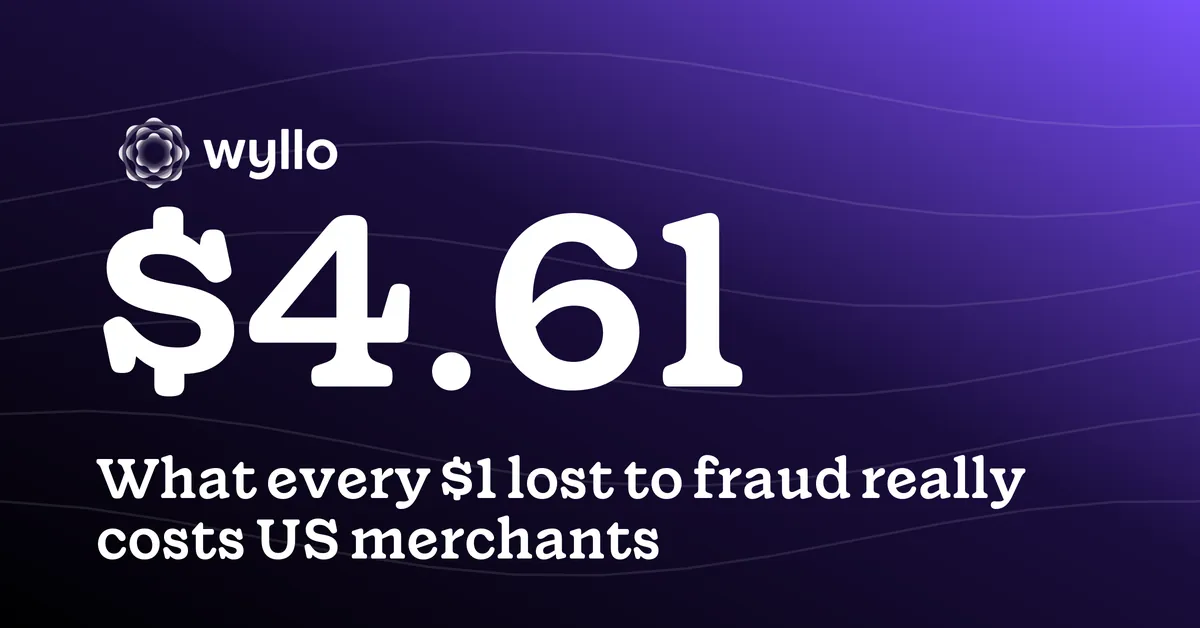
The operational burden is measurable too. According to the LexisNexis Risk Solutions 2025 True Cost of Fraud Study for ecommerce and retail, every $1 of fraud costs US merchants $4.61 once investigation, review, and recovery are counted, and 41% of North American merchants still depend on manual processes to prevent fraud. A rules stack that generates flags faster than a team can clear them ends up declining by default.
Customers notice. PYMNTS Intelligence data published in September 2026 found 56% of US consumers had experienced a false payment decline in the prior three months, and 42% abandon their carts after a failed payment. Baymard Institute’s 2025 checkout research lists “the credit card was declined” as the reason 10% of abandoning shoppers gave for leaving checkout. Some of those declines were correct. The rest were revenue the merchant paid to reject.
How to Measure False Positive Rate vs. False Decline Rate vs. Insult Rate
Most fraud programs track a chargeback rate and an approval rate. Neither says how many good customers were declined. Three related metrics do, and the industry uses the terms loosely enough that it is worth pinning down the formulas before comparing numbers across teams or vendors.
| Metric | Formula | What it tells you | Who uses it |
|---|---|---|---|
| False positive rate | Legitimate orders flagged or declined ÷ all legitimate orders | How often the tool is wrong about good customers; the model view | Data science, fraud operations, vendor evaluations |
| False decline rate | Legitimate orders declined ÷ all orders | What share of total order flow was turned away in error; the revenue view | Finance, ecommerce leadership |
| Insult rate | Legitimate orders declined ÷ all declined orders | What share of your declines were wrong; the precision view | Fraud teams tuning rules and thresholds |
A worked example: a merchant processes 100,000 orders in a month and the fraud stack declines 5,000. Later analysis shows 3,500 of those declines were legitimate, and 1,500 were real fraud attempts.
- False positive rate: 3,500 ÷ 98,500 legitimate orders = 3.6%
- False decline rate: 3,500 ÷ 100,000 orders = 3.5%
- Insult rate: 3,500 ÷ 5,000 declines = 70%
Same month, same declines, three different headlines. The false decline rate looks tolerable. The insult rate says seven of every ten “fraud” declines were good customers, and that is the number that should drive tuning.
For benchmarking, MRC’s 2025 report notes that 55% of MRC members report false positive rates of 2% or less, with the share reporting rates above 10% falling significantly year over year. MRC treats “false positive” and “customer insult” as the same metric, a reminder to confirm definitions before comparing against anyone else’s figure.
The hard part is the numerator, because the decline destroyed the evidence that the order was good. Practical proxies include successful retries with the same customer details, declined customers who purchase again within 30 days, and manual review reversals. None is perfect. Tracking the trend beats tracking nothing.
Why Do Fraud Tools Generate False Positives?
The causes are structural. They come from how most fraud detection software is built, not from any one vendor’s execution, and they compound each other.
Rules Engines Reduce Judgment to Thresholds
A rule is a fixed statement: decline if the AVS result is a mismatch, decline if more than five orders arrive from one IP in an hour, hold anything over $500 shipping to a new address. Rules are auditable, explainable, and fast, which is why they persist. They are also blind to context by design. The AVS rule cannot tell a stolen card from a customer who moved last month, a gift going to a relative, or a shopper whose bank formats addresses differently. Mismatches are common among perfectly legitimate orders, so a rule that declines on that signal alone turns a weak correlation into a hard verdict.
Fraud rules also accumulate. Each incident spawns a new rule, few are retired, and over time the stack encodes every past attack while quietly declining the customers who happen to resemble one. The false positive rate of a rules engine drifts upward with age for exactly this reason.
Single-Transaction Models Miss the Relationship
Most fraud models score the order in front of them using the signals available at checkout: device, IP, BIN, AVS, cart contents, email age. That snapshot has no memory. A customer with five years of clean purchases looks identical to a brand new account if the model can only see the current session.
The result is a model most uncertain about precisely the customers it should be most confident in. Loyal customers doing something new (a bigger order, a different shipping address, a new phone) generate the same anomaly signals as a fraudster, because there is no relationship to weigh the anomaly against.
Identity-Only Signals Punish Legitimate Change
Device fingerprints rotate as people upgrade phones. IP addresses change with networks, travel, and carrier-grade NAT. Email aliases multiply. A fraud system that treats identity stability as a positive signal will, by construction, penalize customers whose identity legitimately changes and reward fraudsters who keep a tidy profile.
The LexisNexis 2025 study found up to 41% of US businesses name identity verification as a major challenge at new account creation, and that poor user experience was the primary driver of abandonment at that step for 37% of US ecommerce respondents. Identity is one input to a decision about intent. When it is the only input, unusual becomes indistinguishable from untrustworthy.
Static Thresholds Assume the Business Stands Still
Thresholds get set once, against the volume, geography, order size, and device mix of the business at the time. Then the business changes: a new market, a new payment method, a wholesale channel, a viral product. Each change broadens what “normal” looks like, and a threshold calibrated to the old distribution flags the new patterns as anomalies until someone retunes it. Most teams retune less often than the business changes.
The same problem hides inside network trained models, which learn a generic normal averaged across thousands of merchants. A $400 average order is suspicious at a commodity retailer and routine at a luxury brand; twelve units to one address is a red flag for a grocer and a Tuesday for a B2B office supplier. Generic calibration is most wrong on exactly the merchants whose customers do not fit the average.
Imbalanced Training Data Tilts Models Toward Suspicion
Fraud is rare. In many ecommerce businesses, fraudulent orders are well under 1% of volume. Models trained on that distribution are penalized heavily for missing the rare positive class, which pushes them toward sensitivity (catch every fraud) at the expense of specificity (leave good customers alone). That trade shows up as fraud model false positives in production.
There is a slower distortion too. Most models learn from chargebacks, which arrive weeks or months after the order. Few learn from the approvals a human made on uncertain orders, or from declined customers who came back to buy. A model that only hears about its misses will keep making its wrongful declines.
Volume Scaling Multiplies Every Other Cause
Even at a constant false positive percentage, the absolute number of wrongly declined customers grows with orders. A 2% false decline rate is 200 declines a day at 10,000 orders and 2,000 a day at 100,000. The team fielding complaints faces a step change while the tool’s configuration has not changed at all.
Growth also strains velocity rules, because more customers means more legitimate outliers. And the review queue that was manageable at low volume becomes a bottleneck, which is when merchants start holding or declining borderline orders by default to keep it from growing. The problem worsens on the same settings, over time, for a merchant doing everything the same way.
How to Reduce False Positives in Ecommerce Without Inviting More Fraud
The assumption that fewer false positives must mean more chargebacks holds only when the decisioning system is binary and starved of signal. Both conditions can be changed. Six steps, each with a way to measure it.
1. Measure the numerator first. Pick one of the three metrics above, instrument the proxies (retry success, 30-day return purchases, review reversals), and report it monthly next to chargeback rate and approval rate. A program that reports only chargebacks keeps optimizing for fewer chargebacks. Target: a false positive or insult rate on the dashboard within one quarter.
2. Build feedback loops from every decision, not just chargebacks. Manual approvals, manual declines, support reversals, and successful retries are labeled outcomes that arrive in hours rather than months. Merchants who pair fraud analysts with AI decisioning get this loop as a byproduct, because every analyst decision is training data. Target: decision to feedback time measured in days, not quarters.
3. Add merchant-specific context to generic models. Tune order size, geographic mix, device patterns, and payment method preferences against your own customers rather than the network average, and retune on business change (new market, channel, or product line) rather than the calendar. Target: a documented recalibration after every material shift in customer mix.
4. Layer positive signals alongside negative ones. Account age, order history, prior successful 3DS completions, support interactions without disputes, and return behavior are trust signals most tools ignore. Connecting them to the decision lifts ambiguous orders from loyal customers out of the decline path. Target: share of declines with zero prior customer history, tracked over time.
5. Route the gray zone to human review instead of a default decline. Analysts should see the orders the model is uncertain about, with full context attached, not everything above a threshold. The MRC’s 2025 Global Fraud and Payments Report found merchants ultimately decline only about one in five (20%) of the orders they screen manually, a rate it describes as remarkably consistent across regions and merchant sizes. The other four in five would have been lost under a blanket decline. Target: a review queue sized to what analysts can clear inside your fulfillment window.
6. Monitor approval rate alongside chargeback rate. Evaluate every rule or threshold change against both. If a new rule cuts chargebacks by 0.1 percentage point and approval rate by 2 points, the rule lost money. Reducing chargeback rate and protecting approval rate are the same project. Target: every rule change logged with its measured effect on both numbers.
There is evidence the approach works at scale. A Mastercard and Financial Times Longitude survey of 300 payments executives, published in February 2026, found 83% say AI has significantly reduced false positives and customer churn rates, and 80% reported that AI helped eliminate unnecessary manual reviews. The tools that get there learn continuously from richer context, which is different from a rules engine with a machine learning label. When weighing whether advanced fraud detection tools actually work or choosing ecommerce fraud protection software, the false positive rate a vendor will commit to is as telling as the catch rate they lead with.
How Wyllo Helps
Every structural cause above comes down to a decision made from too thin a view of the customer. Wyllo, the risk intelligence platform for commerce, is built to widen that view: it connects signals across checkout, returns, claims, support, chargebacks, account behavior, devices, and email patterns, applies merchant-specific context, and recognizes coordinated abuse that no single-transaction score would catch. Better context reveals intent, and intent is what lets a system approve the unusual but legitimate order with confidence.
Three products do the most work on false positives:
- Wyllo Payment Fraud Protection pairs AI decisioning with human fraud analysts. The model decides the clear cases; analysts review the gray zone with full customer context, and every analyst decision feeds back into the model. Higher approval rates on real customers, stronger catch rates on actual fraud, and an optional chargeback guarantee that turns residual risk into a predictable line item.
- Wyllo CX Support puts risk scores and next best actions inside the support tools your team already uses, so a customer asking about a declined order gets a fast, informed answer instead of a scripted apology.
- Wyllo Claim and Policy Abuse Prevention catches account takeover, friendly fraud, and policy exploitation at the journey level, which removes the pressure to overtighten checkout rules to compensate for abuse that happens after the sale.
Judgment over rules.
Frequently Asked Questions
What is a false positive in fraud detection?
A false positive in fraud detection is a legitimate order that a fraud tool flags or declines as fraudulent. The customer is real and the payment is authorized, but a rule, model score, or identity check judged the transaction too risky. False positives are the counterpart to false negatives (fraud that gets through), and every fraud system trades one against the other. In ecommerce they are often called false declines or customer insults.
How do you calculate false positive rate in fraud detection?
Divide the number of legitimate orders your system flagged or declined by the total number of legitimate orders in the same period. A related metric, the insult rate, divides wrongly declined orders by all declined orders and shows what share of your declines were mistakes. The challenge is identifying which declines were legitimate; common proxies include successful retries, repeat purchases from declined customers within 30 days, and manual review reversals.
What is a good false positive rate for ecommerce fraud detection?
Lower than most rules based systems deliver. MRC’s 2025 Global Payments and Fraud Report found 55% of MRC members report false positive rates of 2% or less, with the share reporting rates above 10% falling significantly year over year. The right target depends on margin, average order value, and repeat purchase economics, but a rate in the mid single digits or higher usually means the tool is declining good customers to compensate for thin signal.
Why do fraud rules create so many false positives?
Rules reduce judgment to fixed thresholds that cannot see context. An AVS mismatch rule cannot distinguish a stolen card from a customer who moved, a gift shipped to a relative, or a bank that formats addresses differently, and mismatches are common among legitimate orders. Rules also accumulate as each incident adds a new one and few are retired, so the stack gradually declines every customer who resembles a past attack.
Do fewer false positives mean more chargebacks?
Not necessarily. The trade only holds when a system makes binary accept or decline decisions from a narrow signal set. Adding customer history, cross-channel context, and merchant-specific tuning lets it approve more legitimate orders without loosening its view of actual fraud, and routing uncertain orders to human review instead of default declines recovers good customers at no chargeback cost. The MRC’s 2025 Global Fraud and Payments Report found merchants decline only about 20% of the orders they screen manually.
How does volume growth affect false positives?
Growth multiplies every other cause. At a constant 2% false decline rate, a merchant going from 10,000 to 100,000 daily orders goes from 200 to 2,000 wrongly declined customers a day. Growth also broadens what “normal” looks like (new markets, channels, devices, payment methods), so thresholds calibrated to the older business flag the new patterns as anomalies, and review queues that were manageable become bottlenecks where borderline orders get declined by default.
Bringing It Together
False positives in fraud detection are not a tuning problem to be solved once. They are the predictable output of tools that decide on a single transaction, from identity signals alone, against thresholds set for a business that no longer exists. The merchants making progress have stopped asking their rules to be smarter and started giving their decisions more to work with: history, cross-channel context, merchant-specific calibration, and a human in the loop for the orders where it matters.
The industry is moving the same way. Order rejection rates are falling, manual review is shrinking, and tools that combine continuous learning with connected context are pulling ahead of static rule stacks. The gap between merchants who measure their false positive rate and those who only measure chargebacks shows up in approval rate, repeat purchase rate, and lifetime value long before it shows up in a fraud report.
Curious how an intent-aware risk intelligence approach would change your false positive rate? Start with Wyllo Payment Fraud Protection for the AI plus human fraud analysts model, or explore the broader Wyllo platform for connected intelligence across the full customer journey.