Why the LTV on your dashboard overstates profitability, which costs belong in the model, and how to compute a number your finance team will sign.
True customer lifetime value is what a customer contributes after the relationship’s costs come out: returns and their processing, claims and appeasements, chargebacks and their fees, and the service time it took to keep them. Most LTV models stop at revenue minus cost of goods, which makes them a measure of gross spend over time rather than value. The distinction sounds academic until you re-rank a customer file by net contribution and watch some of the “best” customers change places with the middle of the pack.
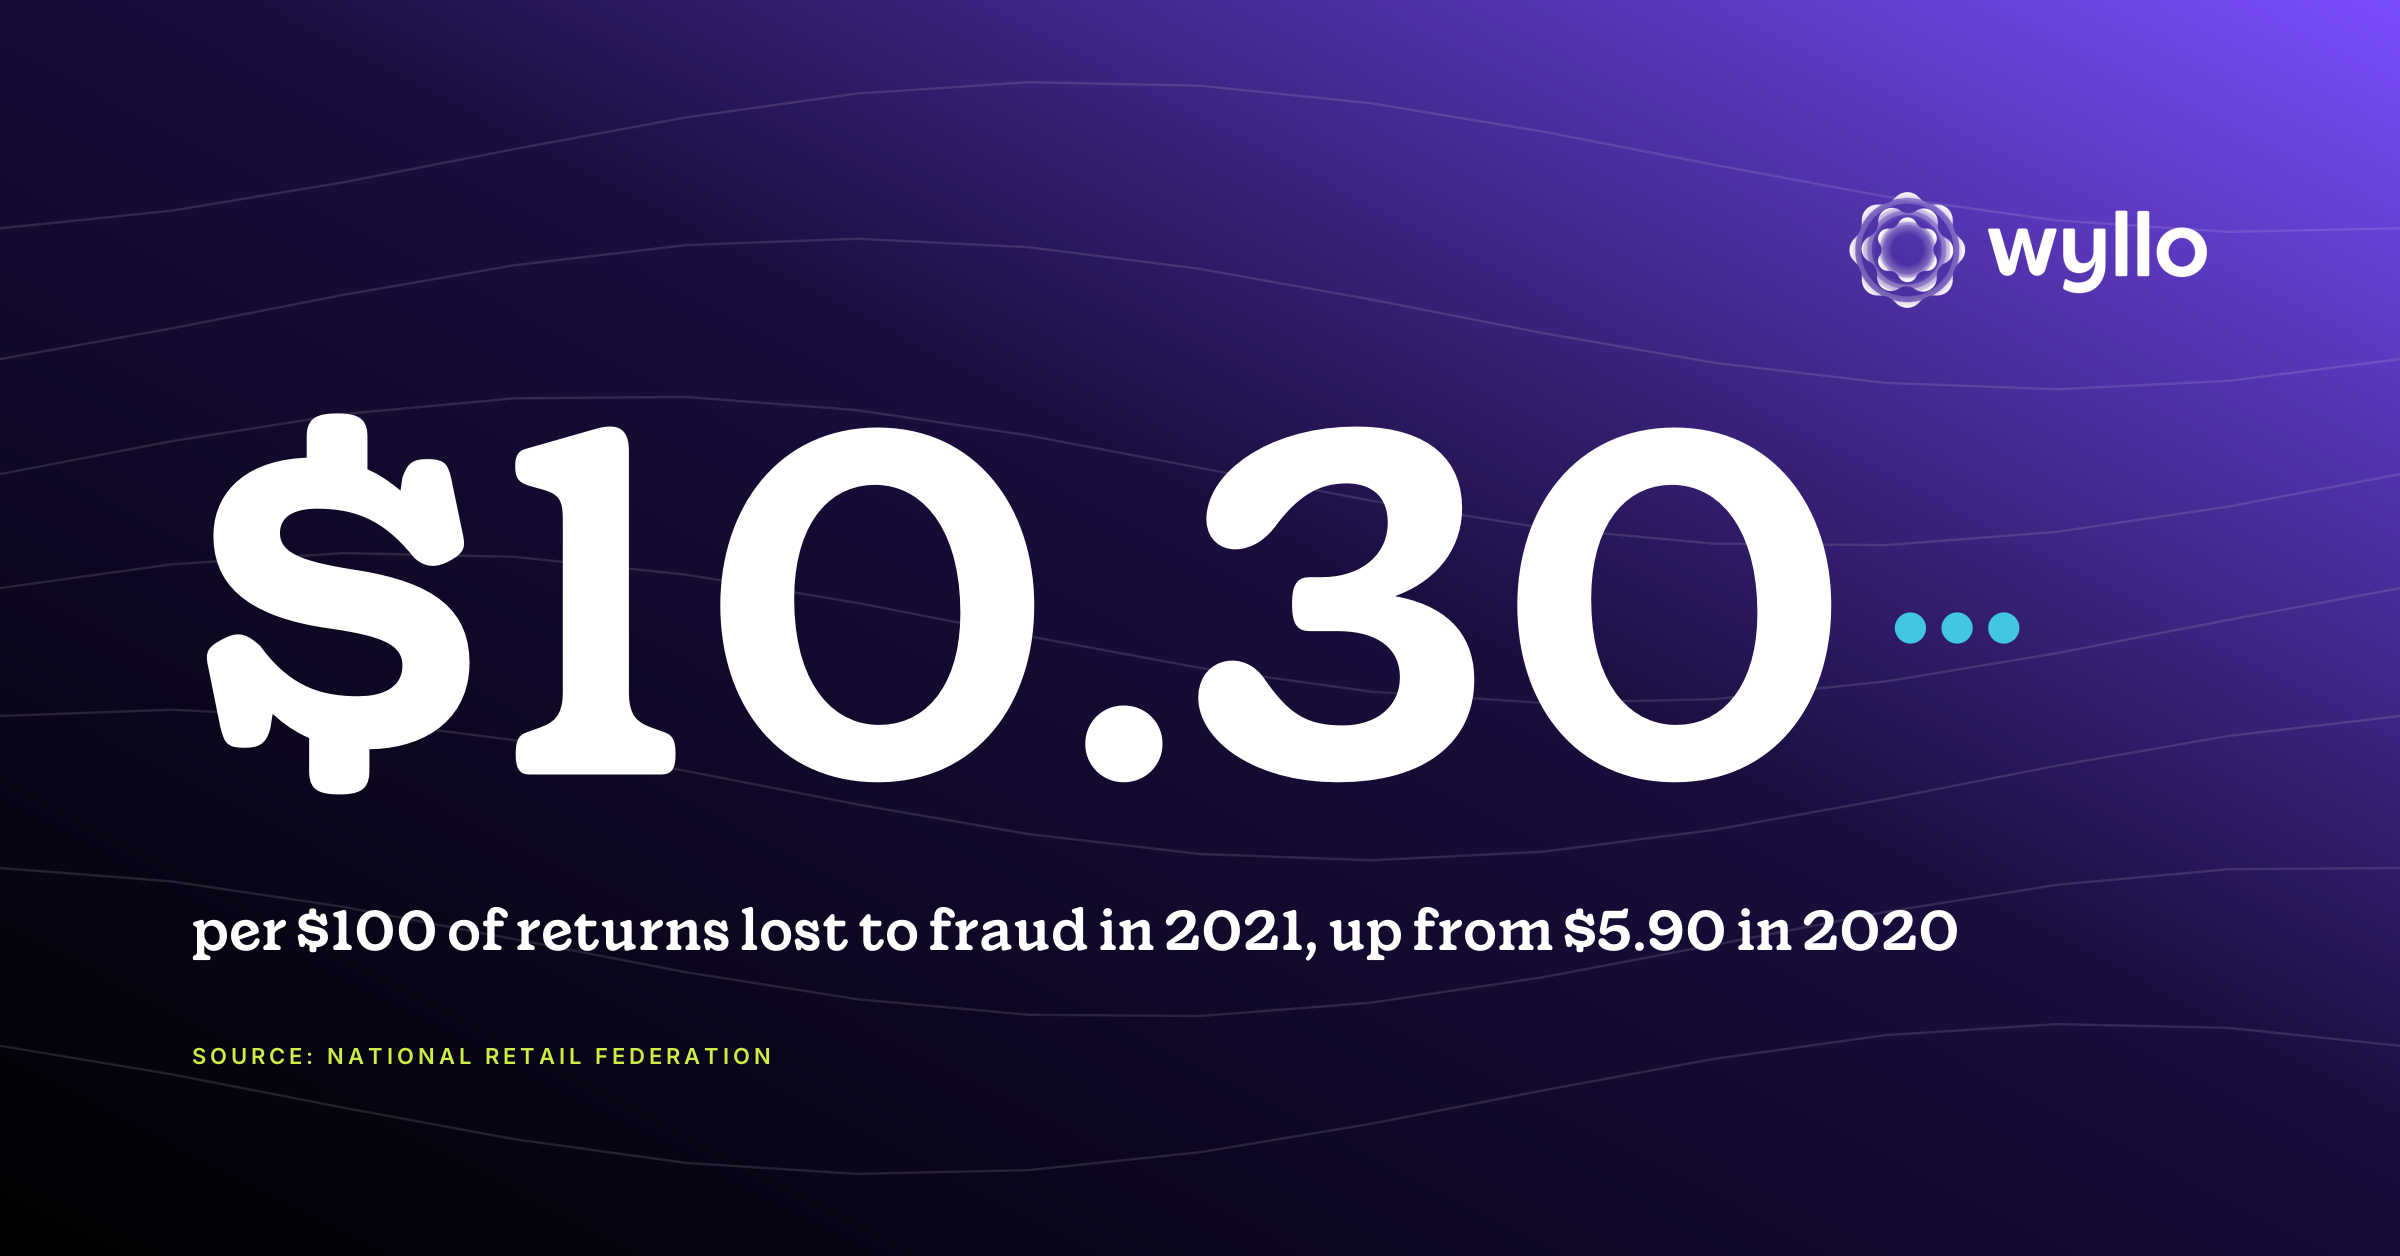
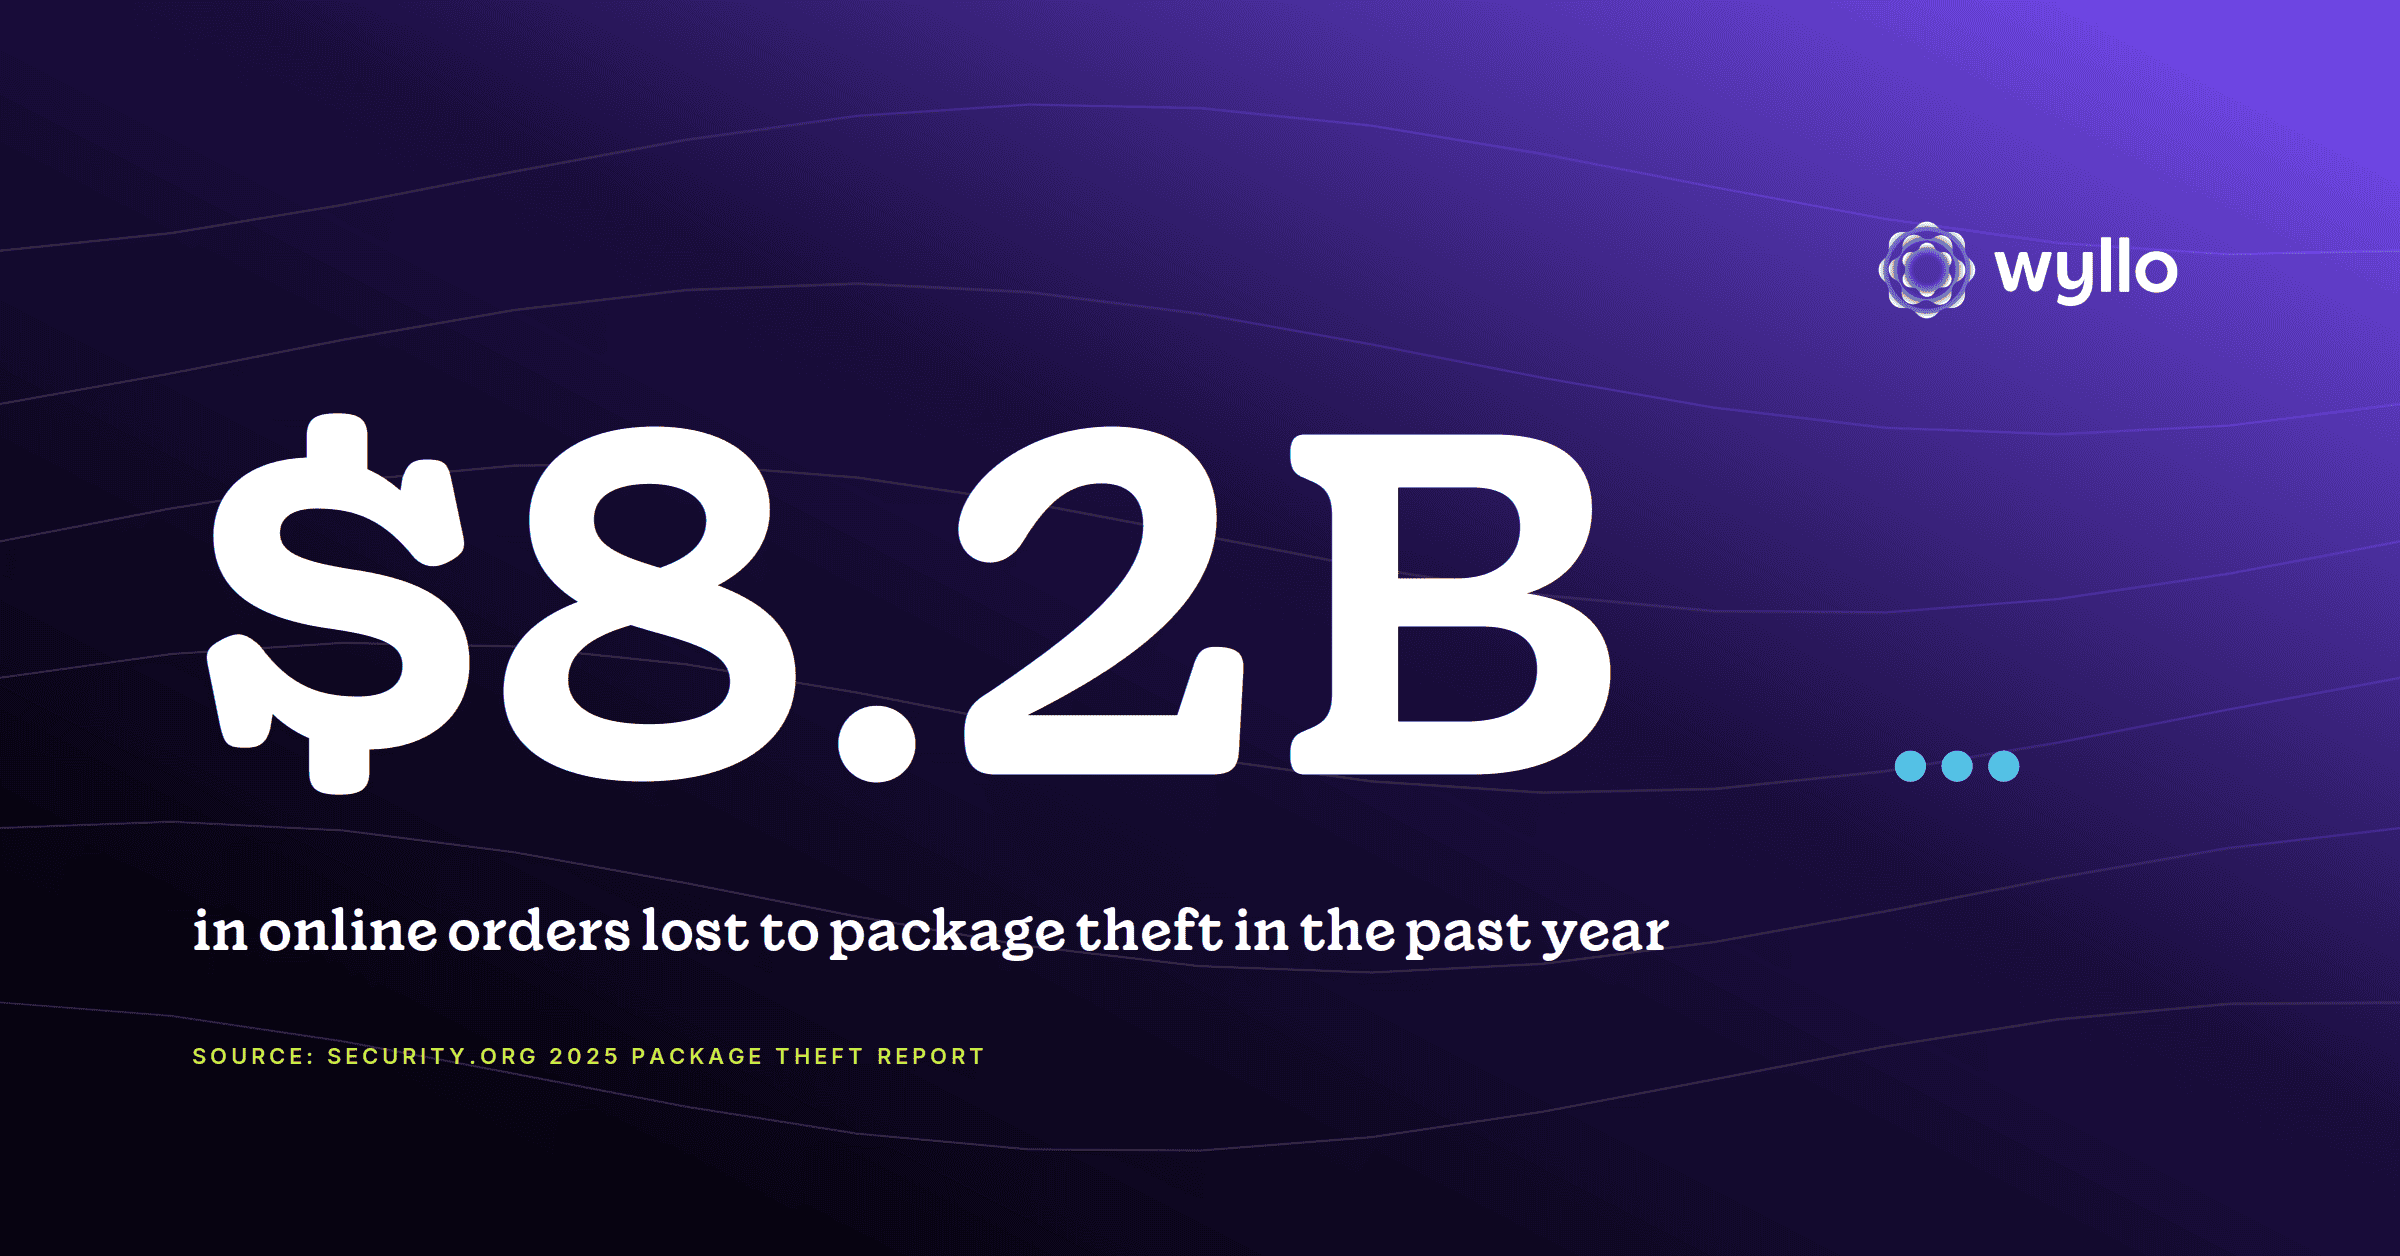
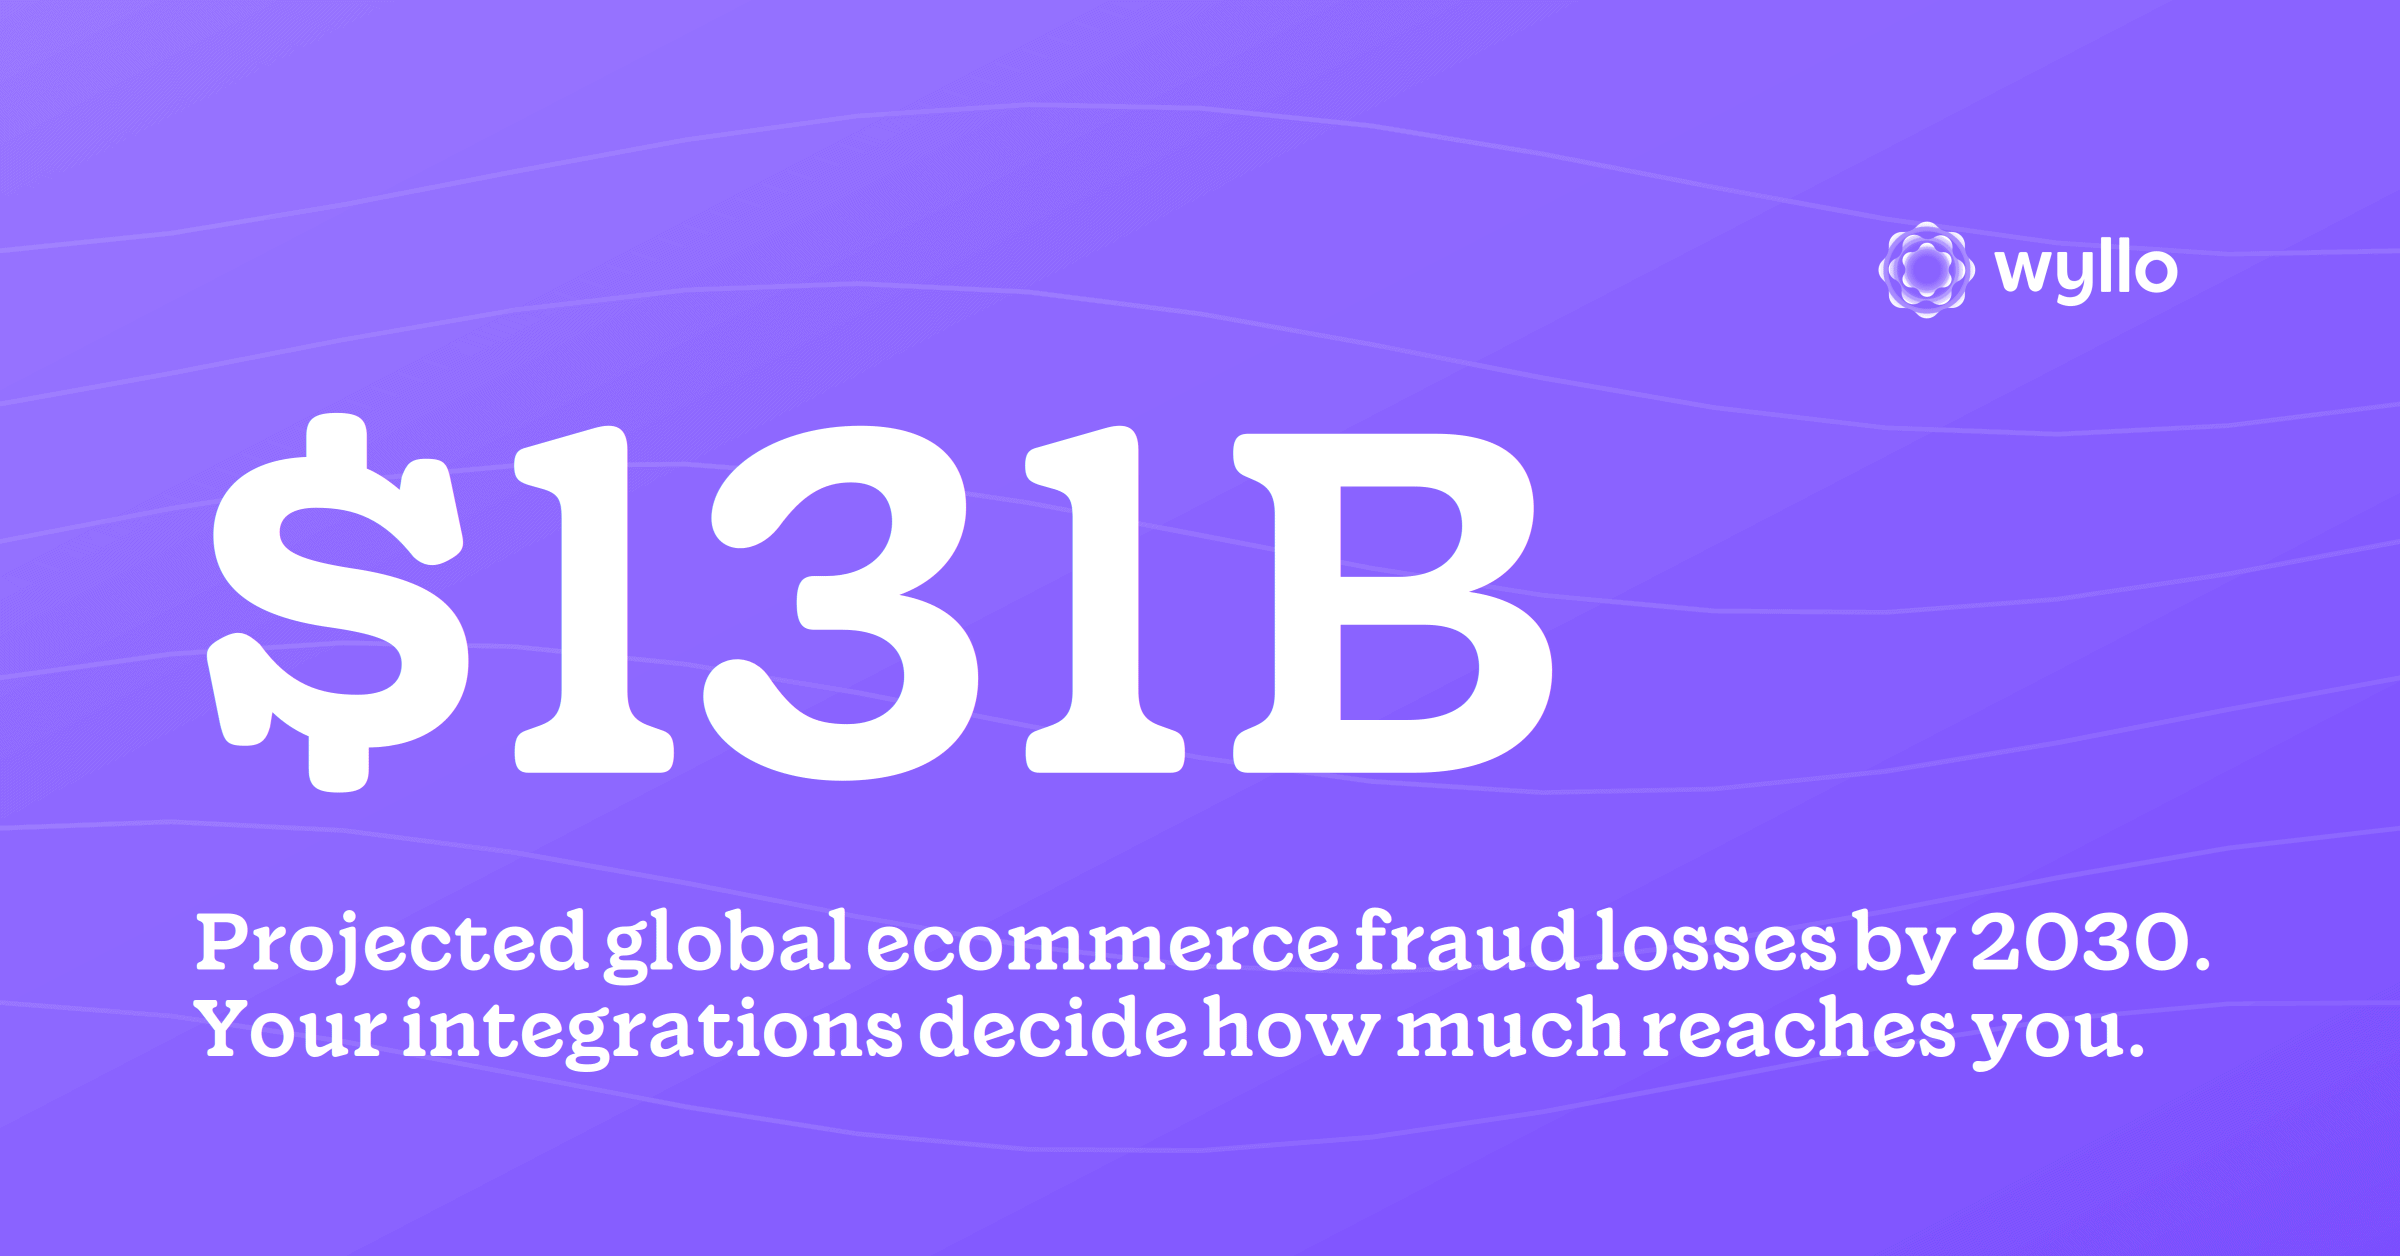
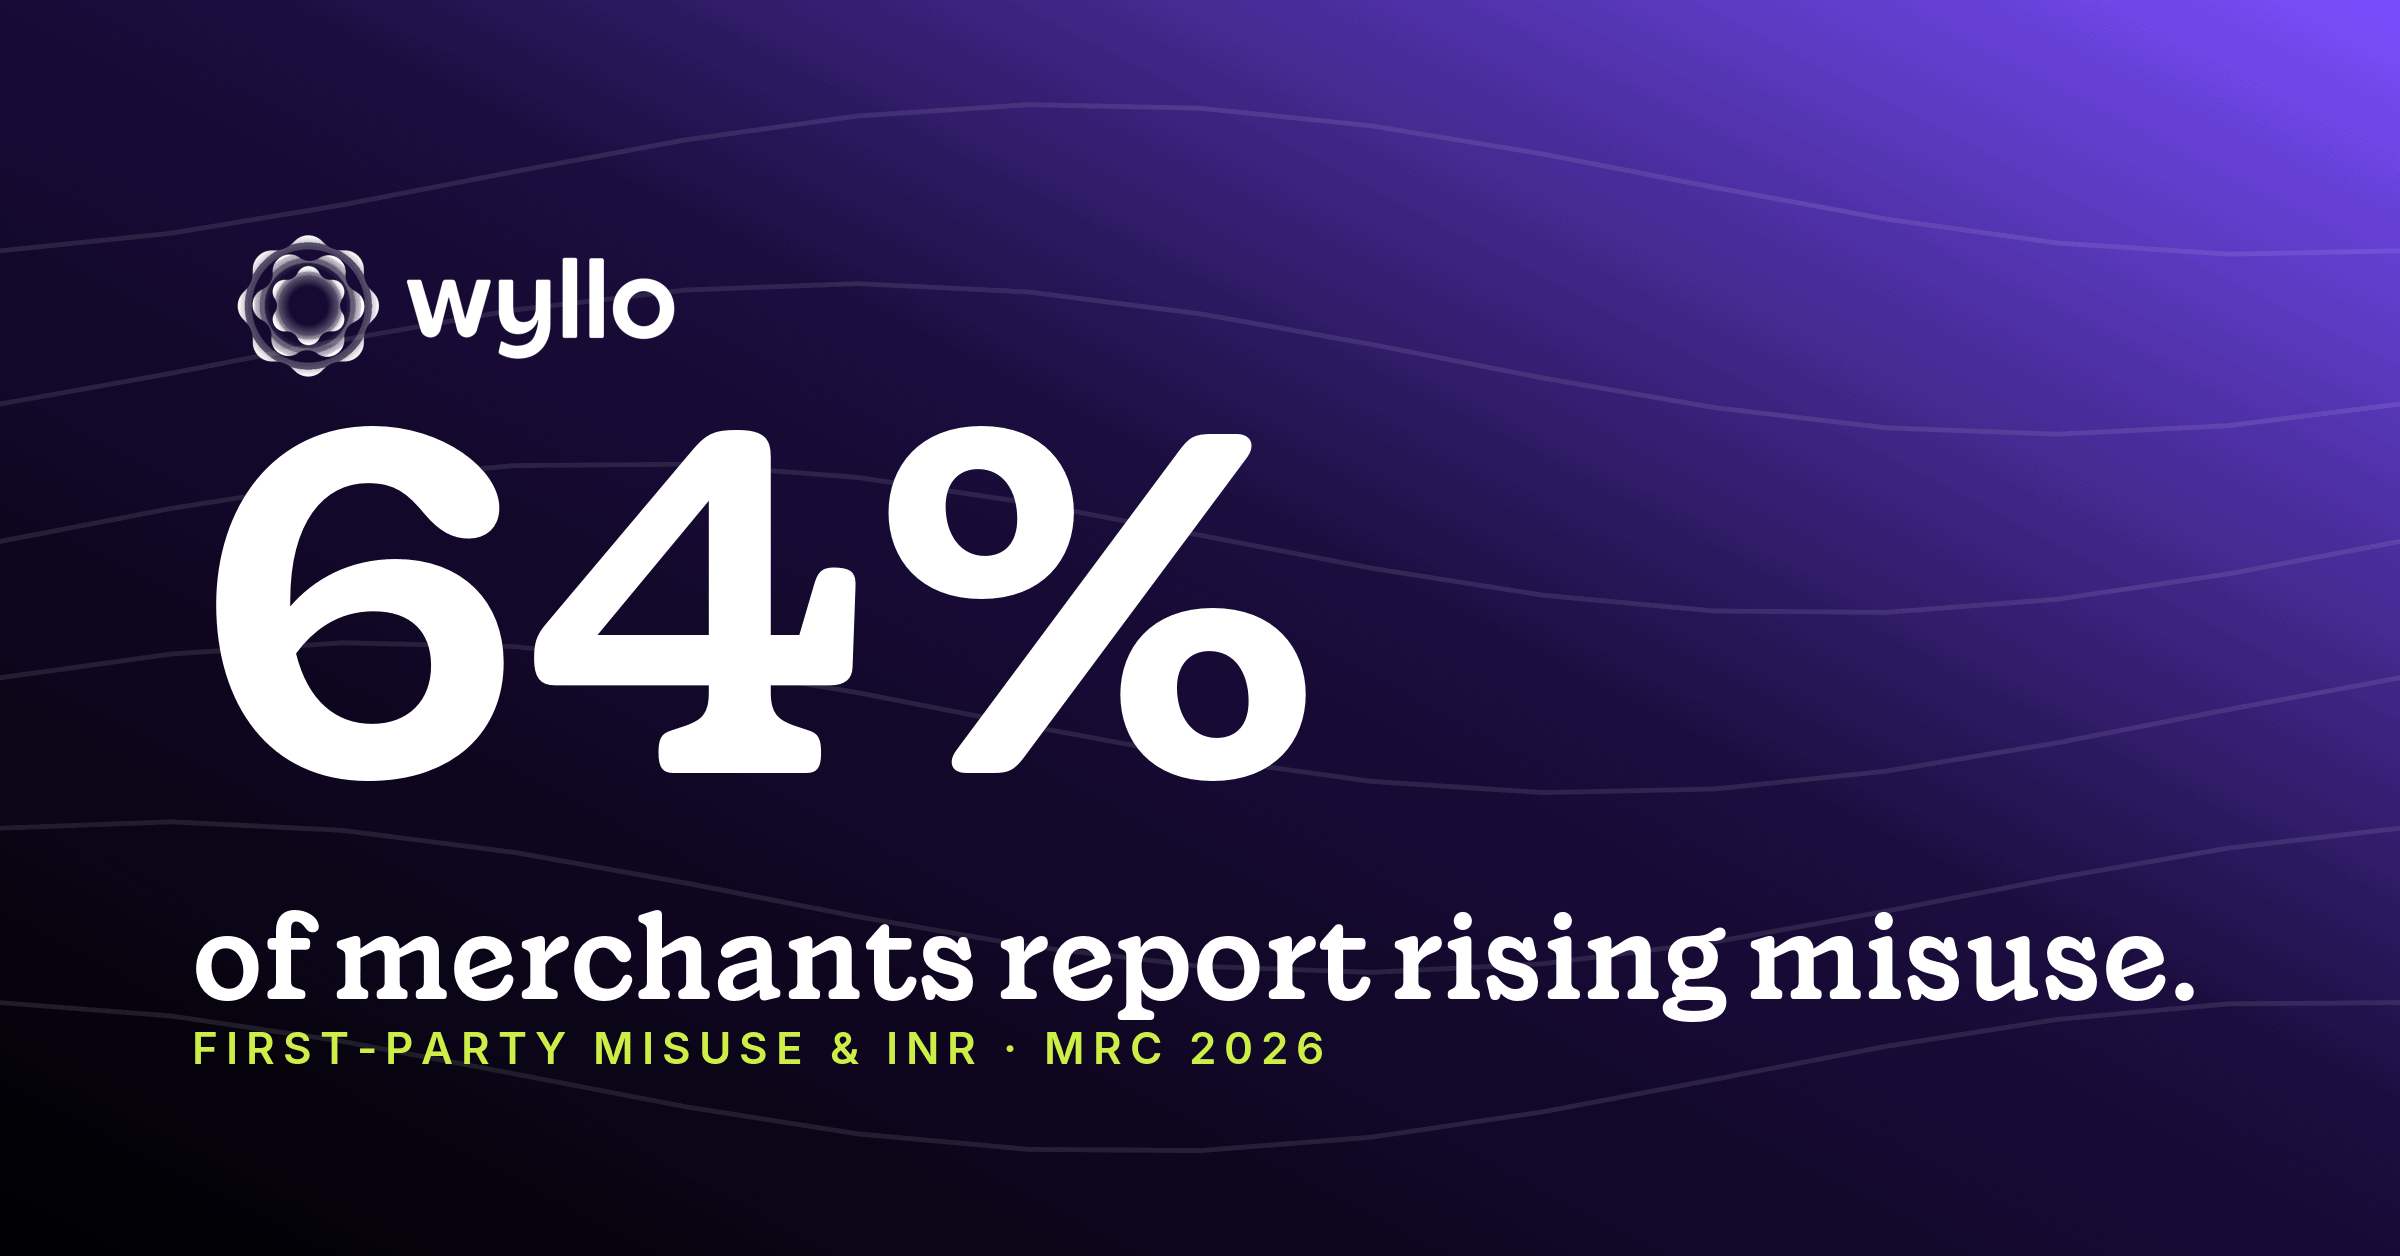
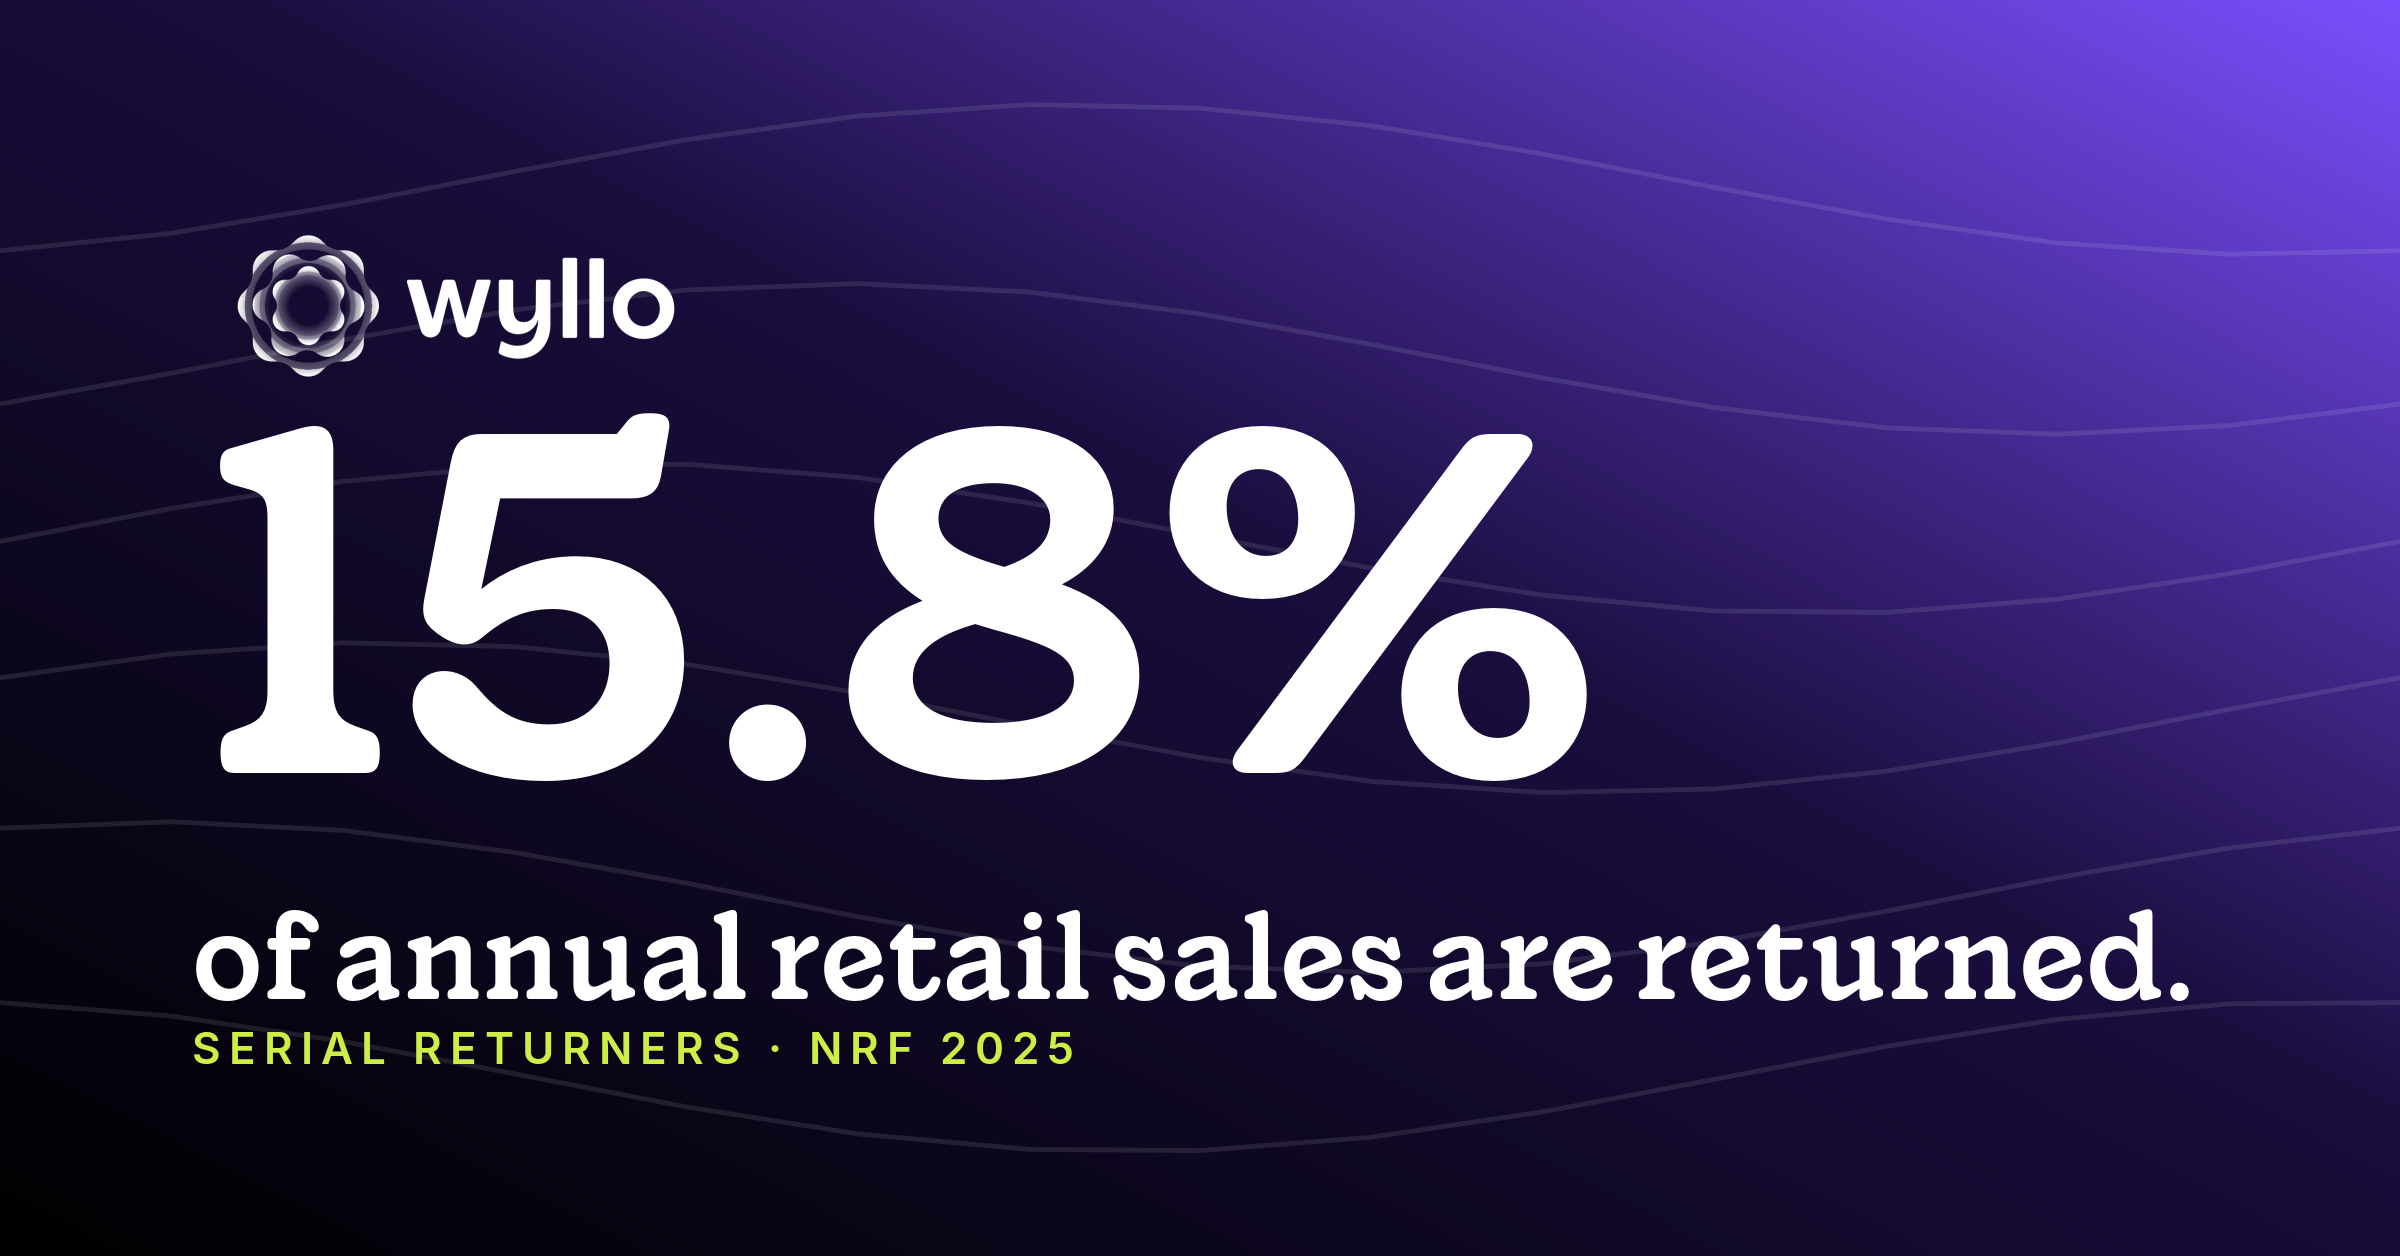
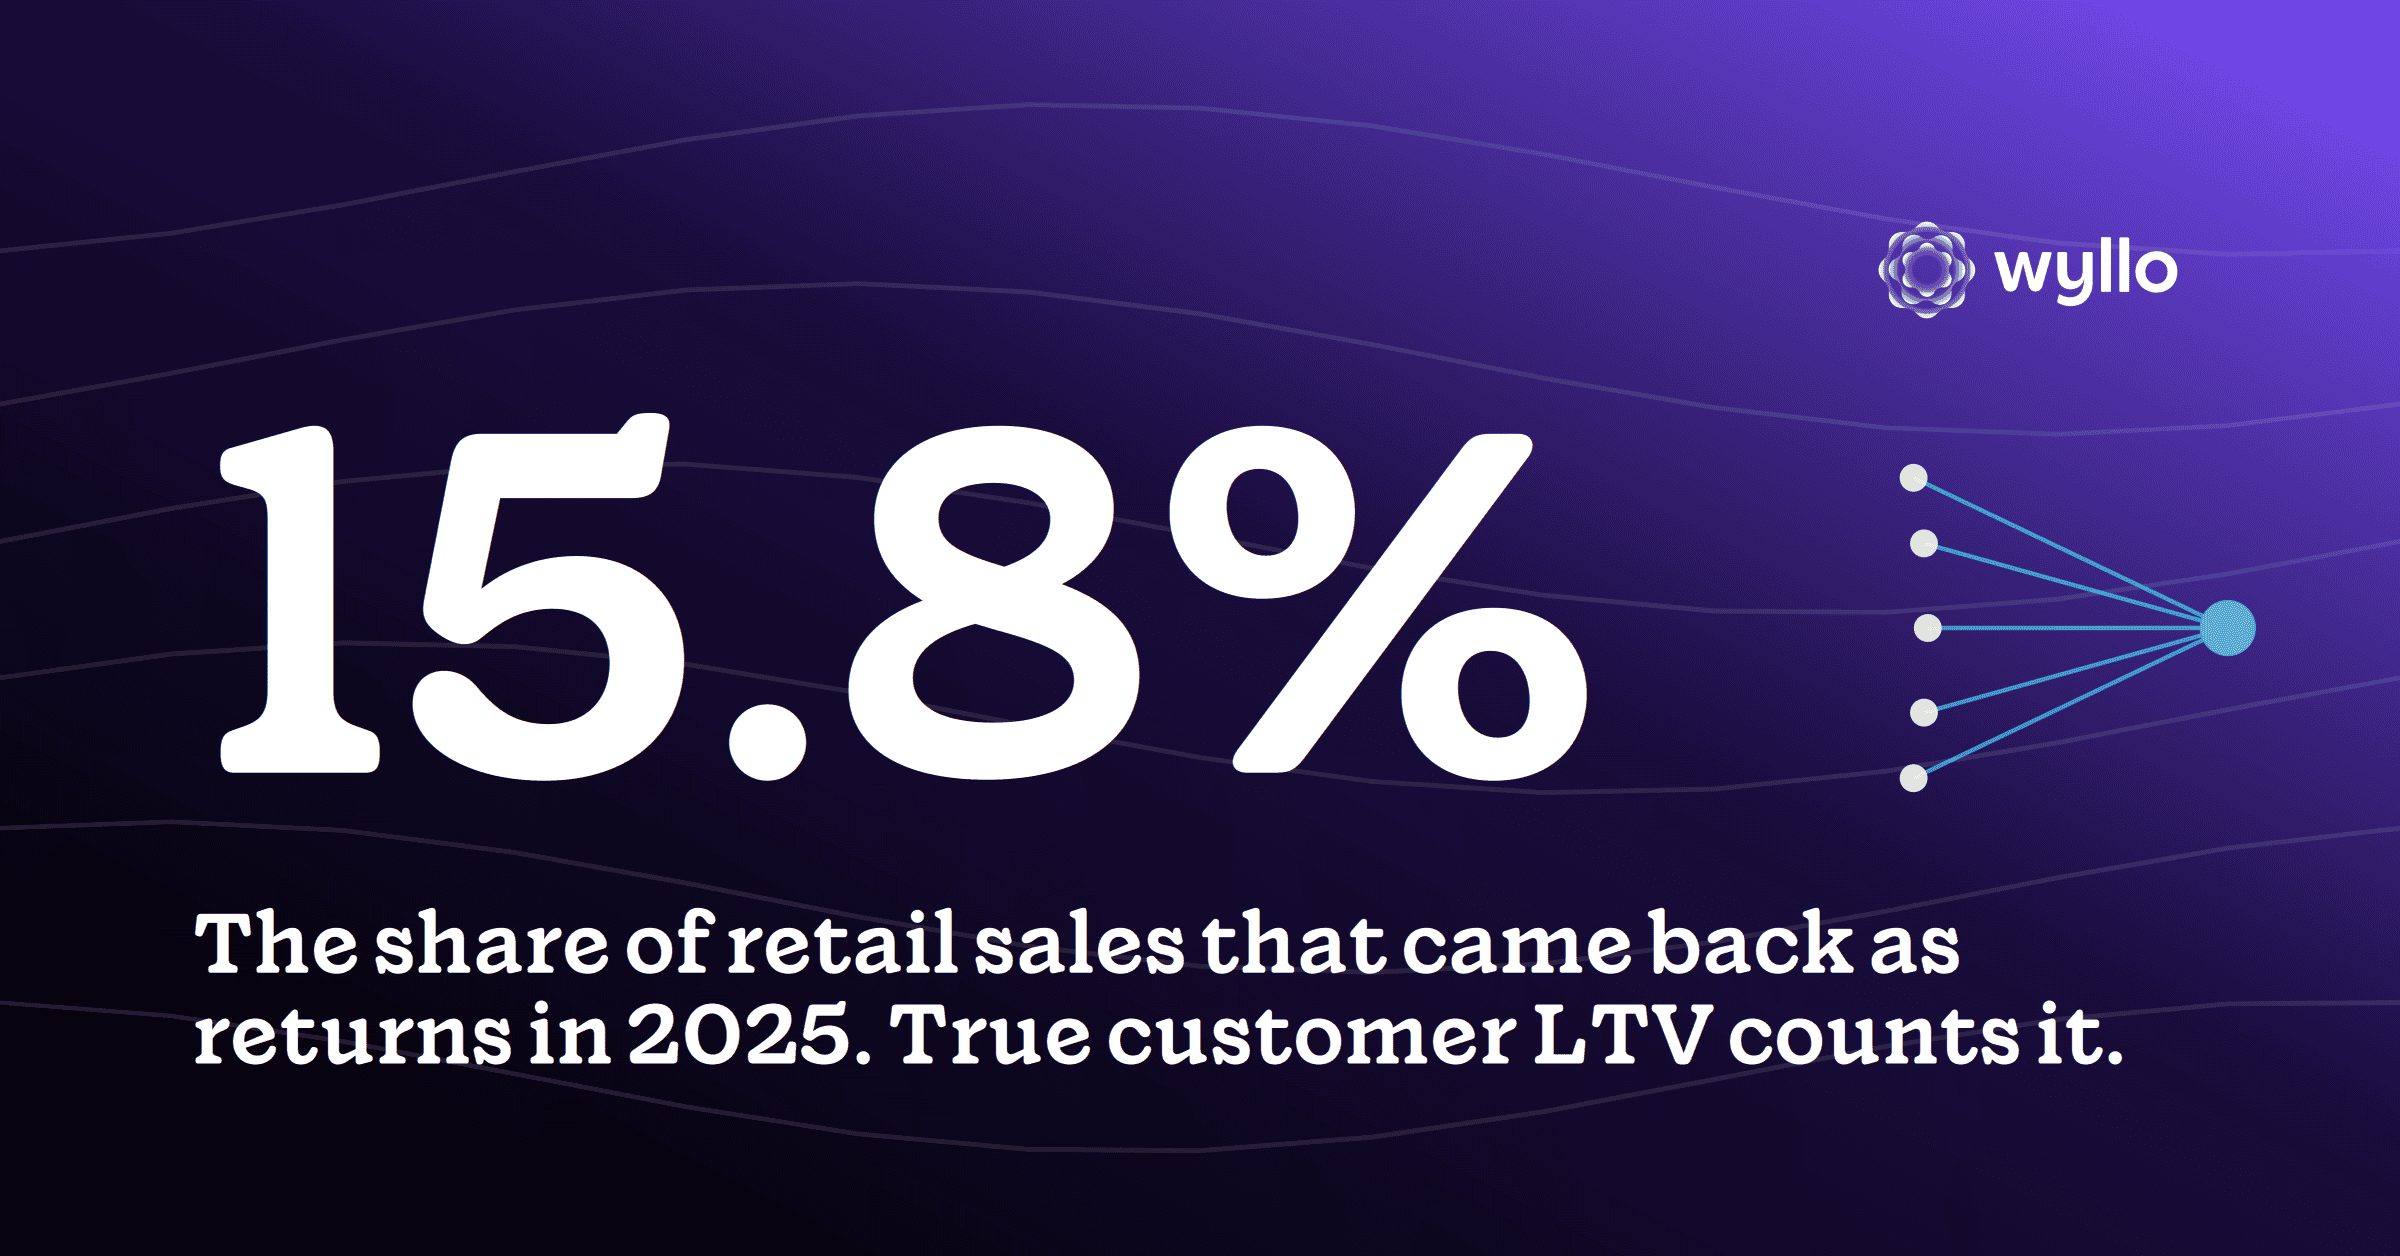
The gap between the two numbers has been widening, because the costs the classic model ignores have been growing. The National Retail Federation projects $849.9 billion in merchandise returned in 2025, or 15.8% of retail sales, with online purchases returned at a 19.3% rate. Disputes now come mostly from real customers rather than stolen cards, with Mastercard putting first-party fraud above 45% of all chargebacks. An LTV model that cannot see any of that is measuring loyalty with the expensive half of the ledger missing.
This post walks through what the standard formula hides, which costs belong in a true LTV calculation, and what changes when customers are ranked by what they actually contribute.
The LTV Formula Most Teams Use, and What It Hides
The standard calculation is some version of average order value, times purchase frequency, times expected relationship length, sometimes netted against cost of goods and acquisition cost. It answers a marketing question: how much revenue does a customer generate, and how much is it worth spending to acquire another one like them.
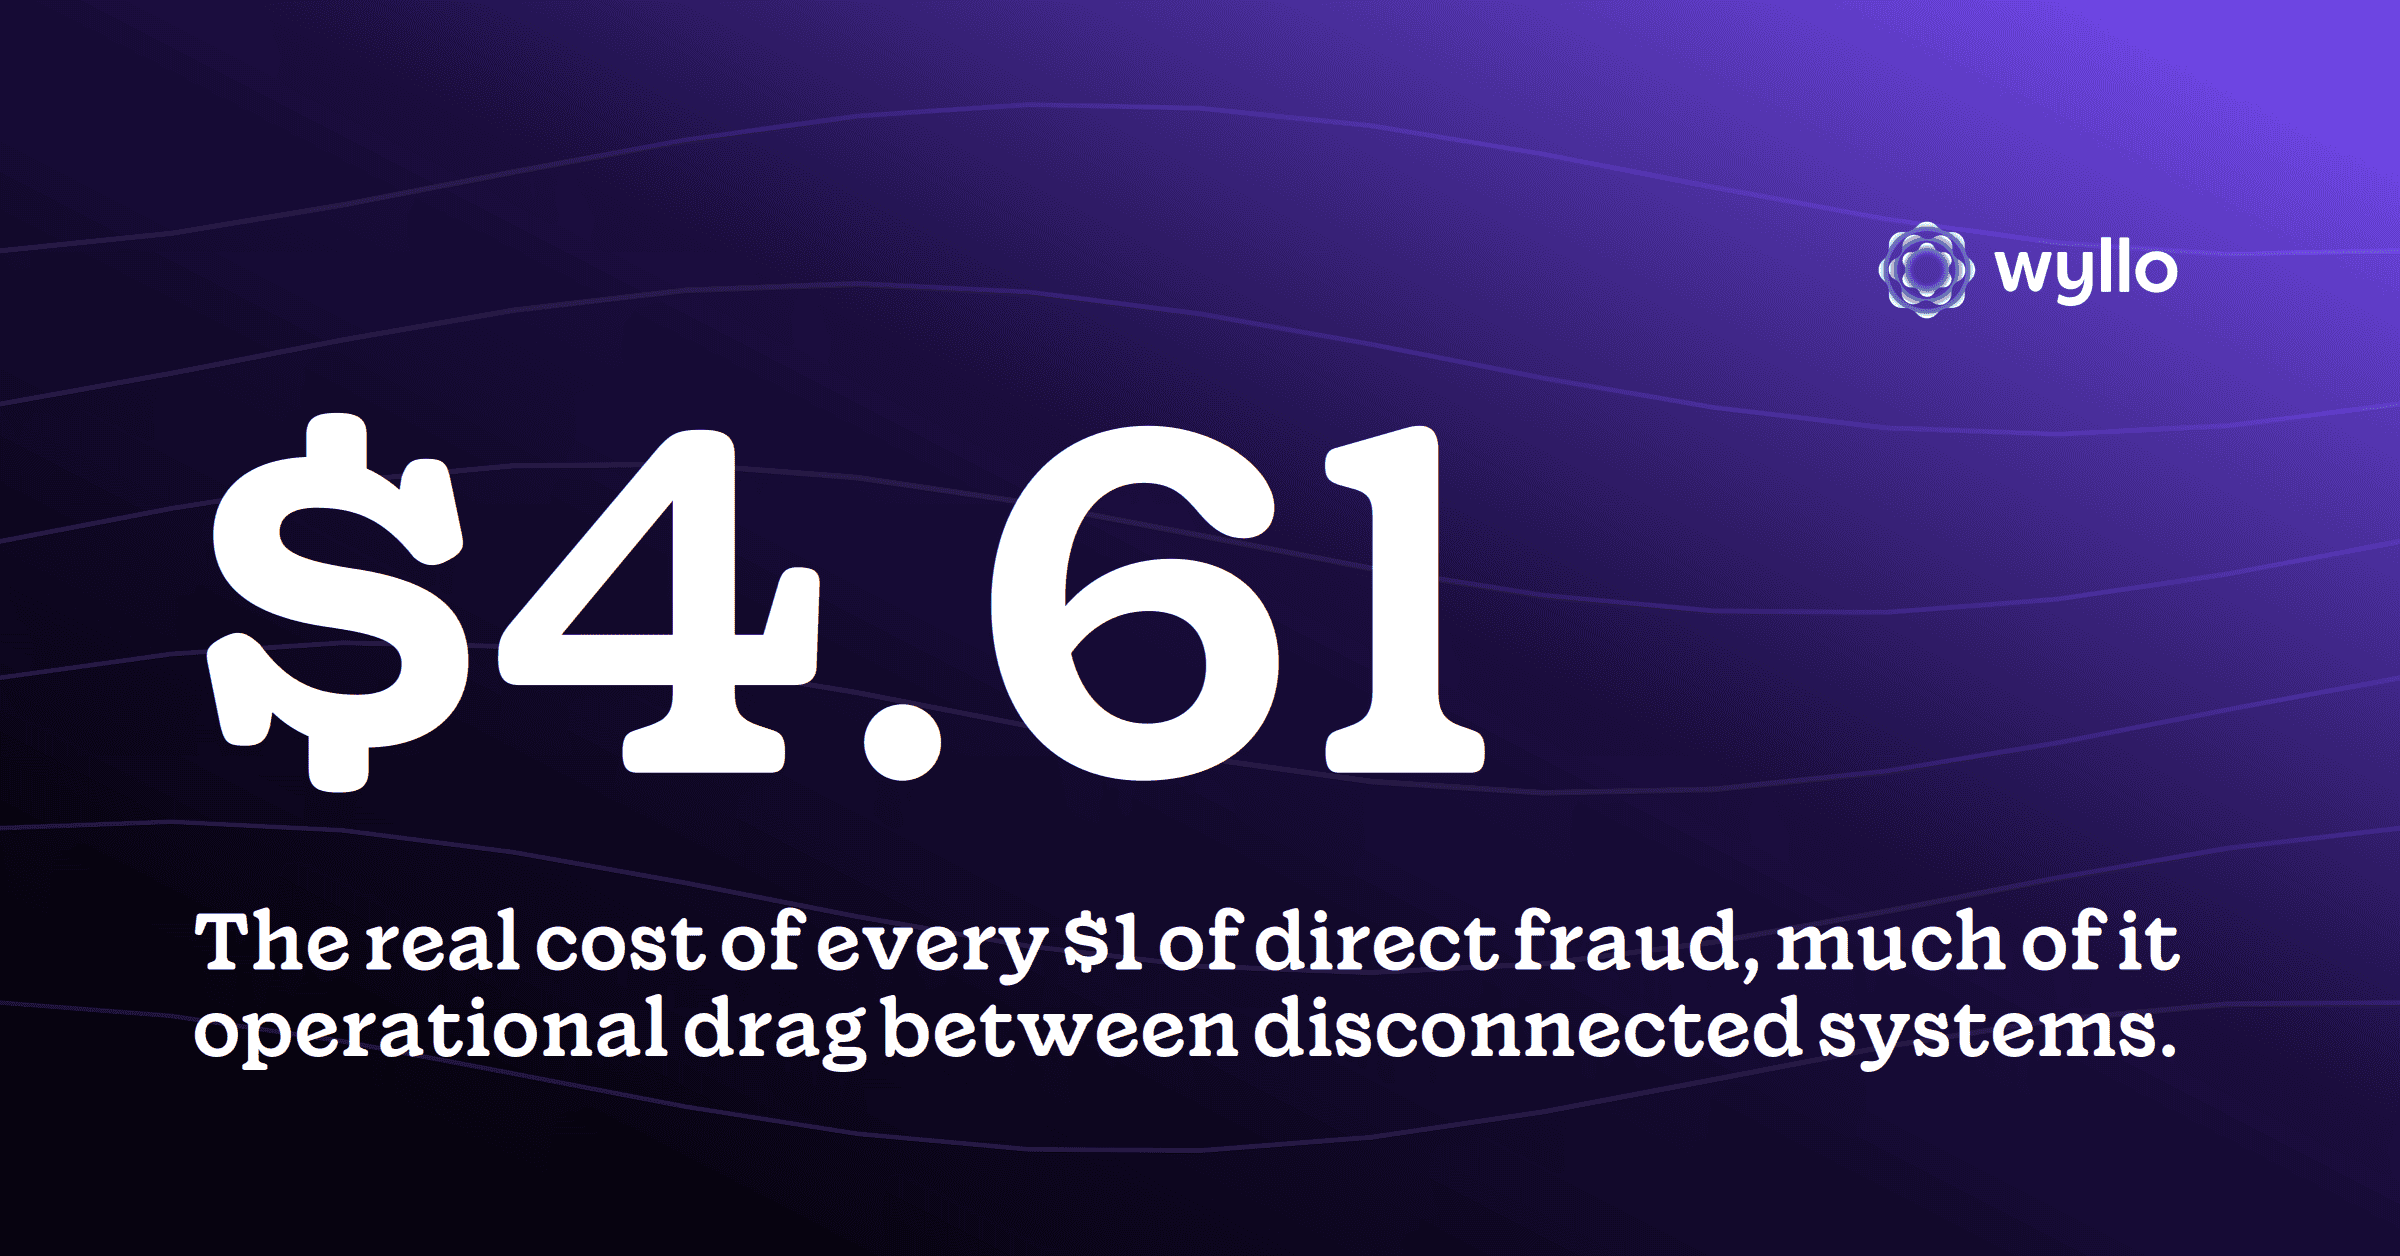
Those are good questions. The trouble is what the formula assumes: that every dollar of revenue is equally likely to stay revenue. A $400 order that comes back as a return, a “damaged item” claim, or a chargeback is not worth $400, and by the time the reverse logistics, the replacement, the fees, and the agent time are counted, it can be worth less than zero. The classic model books the order and never sees the sequel.
The Costs That Never Make the Model
Four categories of cost decide whether a high-spending customer is actually profitable, and all four live outside the systems where LTV is usually computed.
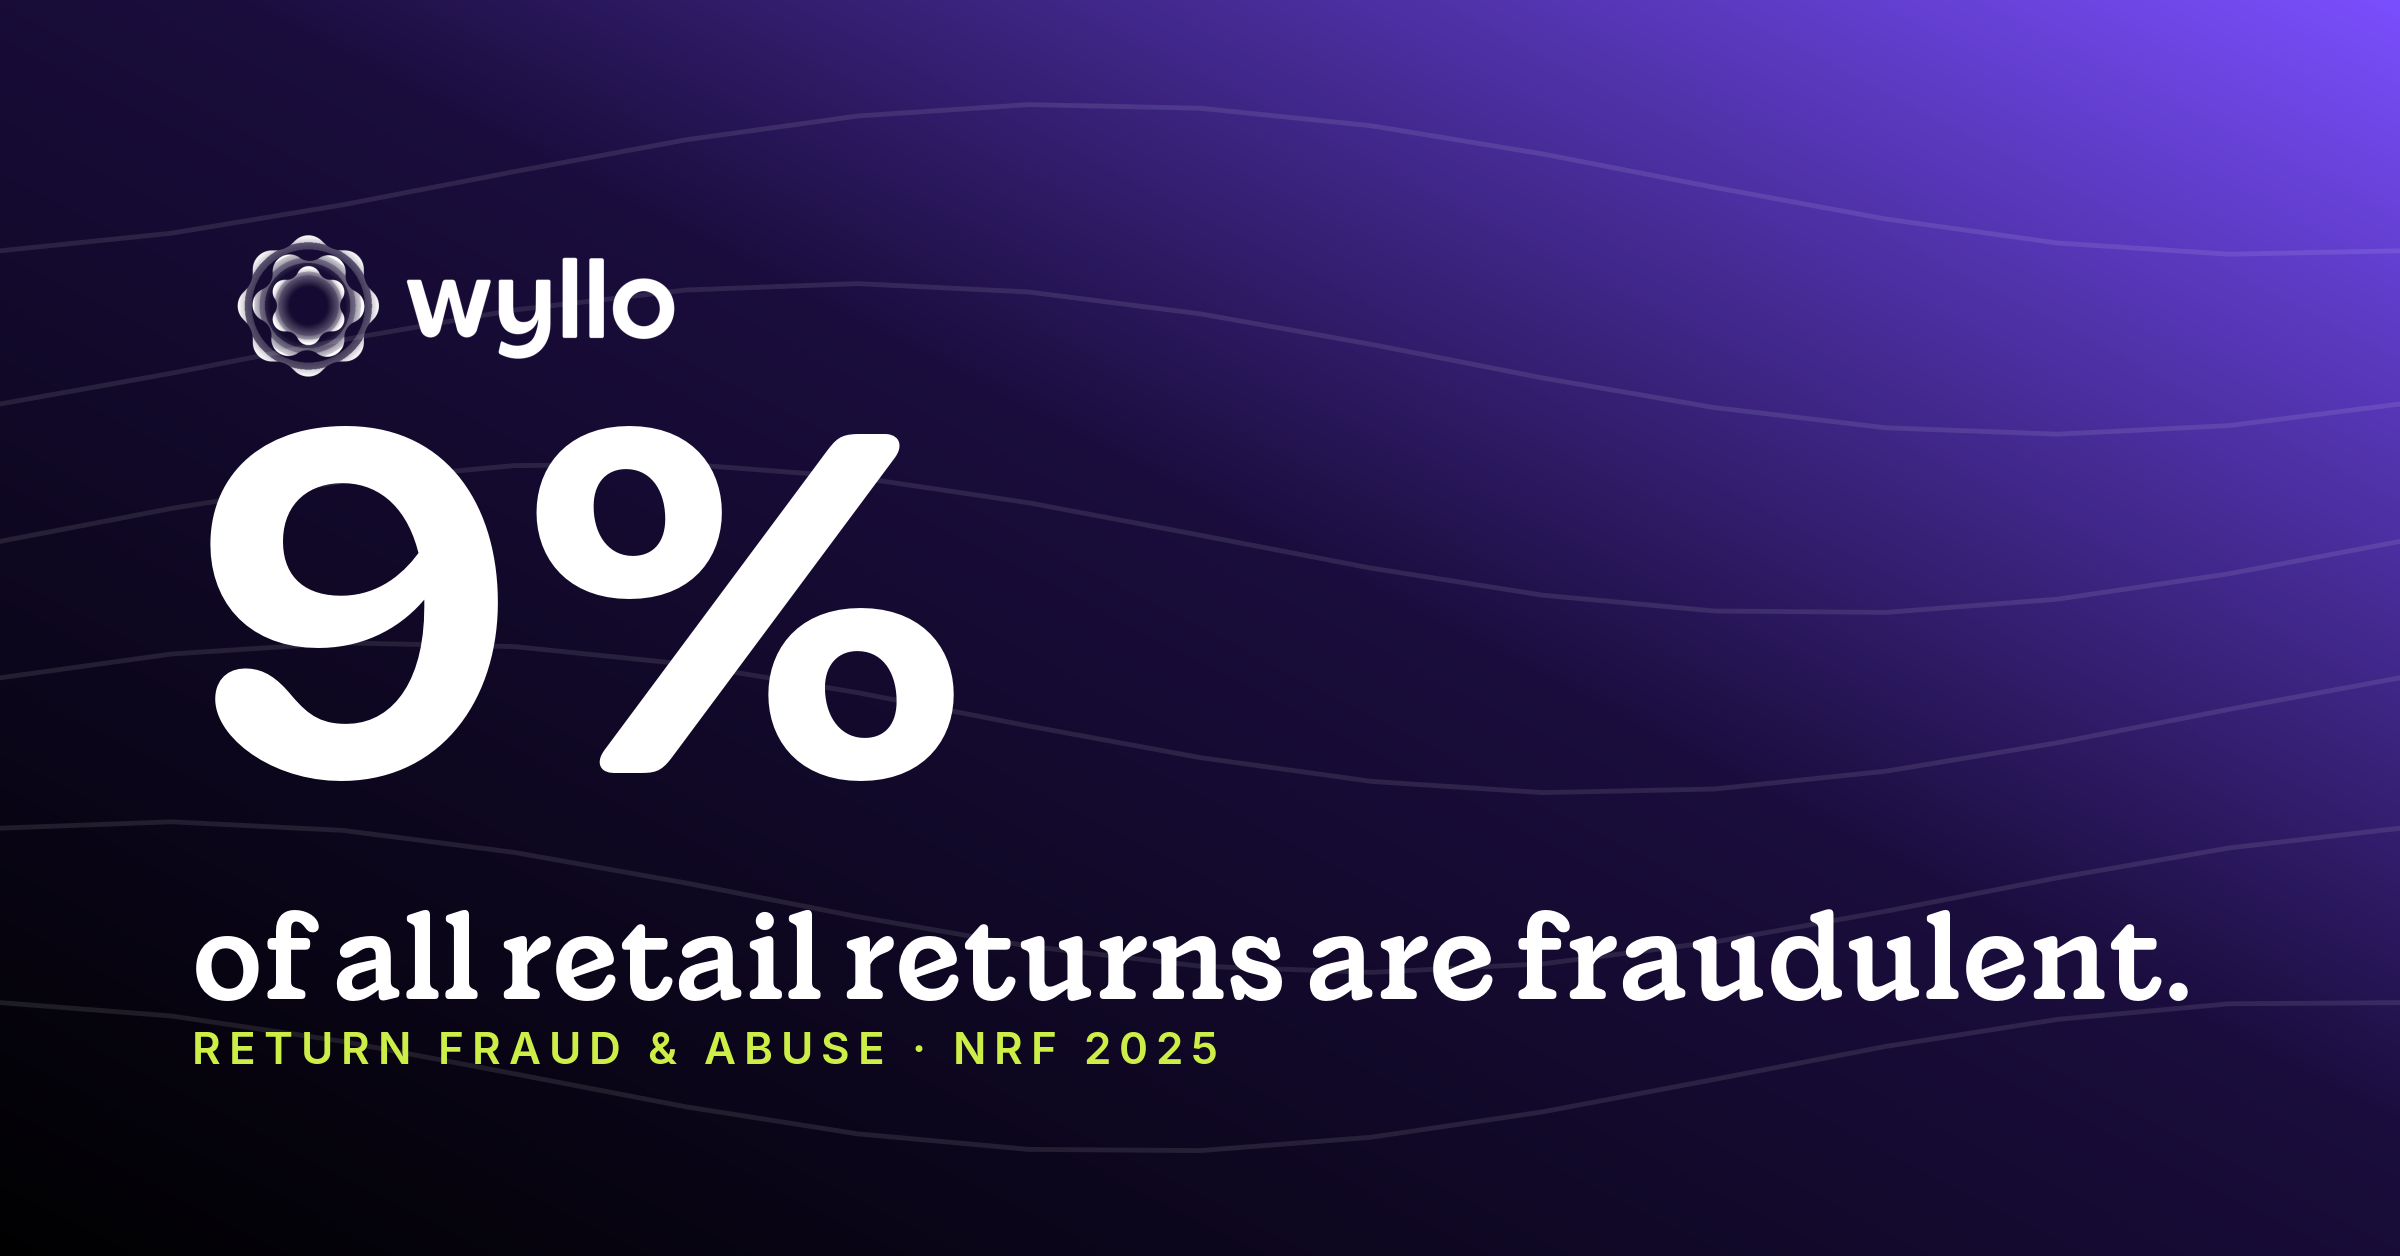
- Returns. At a 19.3% online return rate, nearly one in five dollars of ecommerce revenue reverses. Each reversal carries shipping, processing, inspection, and remarketing costs, and the NRF finds nearly two-thirds of consumers admit to practices like wardrobing and bracketing that inflate them.
- Claims and appeasements. Item not received claims, damage claims, and the refunds and credits support hands out to close tickets. Individually small, they compound quietly, and they concentrate: a small share of customers typically drives a large share of claim cost.
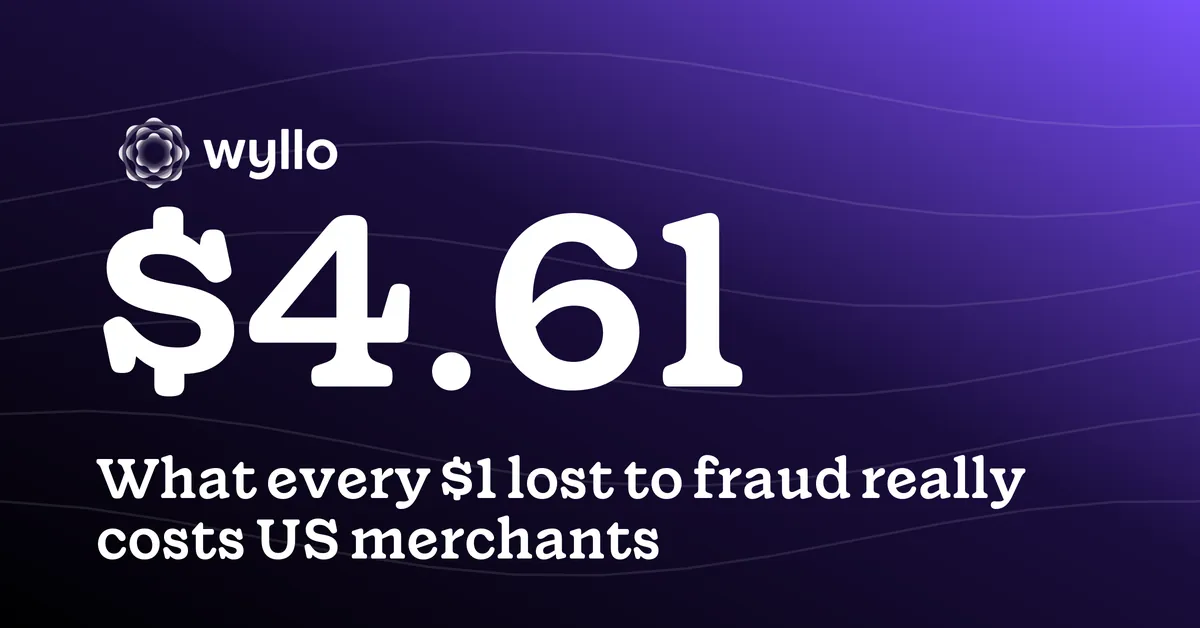
- Chargebacks. A dispute costs the order, the product, and a fee stack on top; the fees and downstream costs regularly exceed the transaction itself. The math is laid out in what chargebacks actually cost, and with first-party fraud driving most disputes, this cost tracks specific customers, not random chance.
- Service load. The customer who opens a ticket on every order consumes margin in agent time even when nothing is refunded.
None of this argues for treating high-cost customers as villains. Most returns are honest, most claims are real, and a generous policy is a growth asset. The argument is narrower: these costs belong in the customer math, because they are the difference between spend and value.
How to Calculate True Customer LTV
The formula is not complicated. For each customer, over the life of the relationship:
- Start with gross revenue, all orders, all channels.
- Subtract cost of goods and fulfillment for what they kept.
- Subtract the post-purchase ledger: refunded revenue plus return processing, claim payouts and appeasement credits, chargeback losses and fees, and an allocated cost for support time.
- Subtract acquisition cost if you want fully loaded economics.
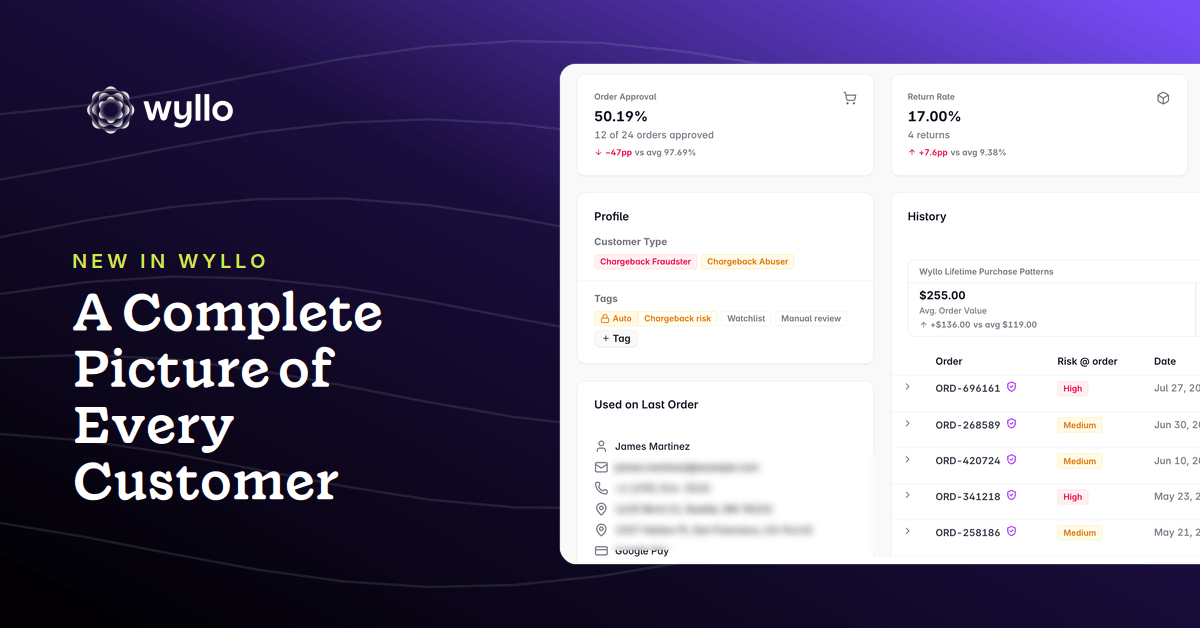
What is left is net contribution, and true LTV is that number projected over the expected relationship. The hard part is not arithmetic but assembly: the inputs live in the order system, the returns platform, the support desk, and the payments stack, which is why a single customer view that includes risk is the practical prerequisite. Merchants who cannot join those systems yet can start smaller: pull the top decile of customers by gross spend and compute net contribution for just that cohort. The exercise usually pays for itself in one meeting.
Retention economics make the correction more valuable, not less. Harvard Business Review’s summary of the research puts acquiring a new customer at 5 to 25 times the cost of retaining an existing one, and cites Bain research associating a 5% improvement in retention with profit gains of 25% to 95%. Retention spend is one of the best investments in commerce, provided it is aimed at customers who are profitable to retain. True LTV is what tells you where to aim it.
What Changes When You Rank Customers by Net Value
The first change is the VIP list. Segments built on gross spend flatter the customer whose returns, claims, and disputes erase the margin on everything they buy, a pattern covered in depth in the case against hype-driven loyalty math. Re-ranking by net contribution moves some of those customers out of the white-glove tier and, just as important, promotes quiet, low-maintenance customers the gross number undervalued.
The second change is policy. Once value is measured honestly, differentiated treatment stops feeling risky: the profitable loyalist earns instant refunds and relaxed verification, the concentrated abuse pattern earns friction, and the policy budget stops being spent uniformly on both. Trust becomes something the data extends in both directions.
The third change is the conversation with finance. A marketing LTV and a P&L that disagree breed mutual suspicion. A true LTV built on net contribution is a number both teams can defend, which is what makes it usable for proving impact in dollar terms rather than in dashboard color.
How Wyllo Helps
True LTV depends on seeing the post-purchase half of the customer, and that half lives in risk systems. Wyllo, the risk intelligence platform for commerce, reads intent across the whole customer journey, which is exactly the data the net value math needs.
- Wyllo Payment Fraud Protection supplies order decisions and risk scores, so revenue quality is visible at the point it is earned.
- Wyllo Return Fraud and Abuse Prevention turns return behavior into customer-level signal instead of an aggregate expense line.
- Wyllo Claim and Policy Abuse Prevention tracks claim and appeasement patterns and links repeat actors across identities.
- Wyllo Chargeback Management accounts for the dispute side of the ledger, from fees to recoveries.
Built for what matters most. The customers who deserve your best treatment are easier to find when the math is honest.
Frequently Asked Questions
What is true customer lifetime value?
True customer lifetime value is a customer’s net contribution over the relationship: gross revenue minus cost of goods, returns and their processing costs, claim payouts and appeasements, chargebacks and fees, and allocated service cost. It corrects the standard LTV formula, which measures revenue rather than value.
How is true LTV different from standard LTV?
Standard LTV multiplies order value, frequency, and relationship length, and rarely subtracts anything beyond cost of goods. True LTV subtracts the post-purchase ledger. The two numbers agree for customers who rarely return or dispute, and diverge sharply for the customers where the decision matters.
What costs should be included in customer lifetime value?
Cost of goods and fulfillment, refunded revenue and return processing, claim and appeasement payouts, chargeback losses and fees, support time, and acquisition cost. The post-purchase categories matter most because they concentrate in a minority of customers rather than spreading evenly.
Is a high-spending customer always a profitable one?
No. Returns, claims, and disputes can erase the margin on a high-spending relationship, and gross-spend rankings hide it. Ranking by net contribution regularly demotes some top spenders and promotes quiet customers the gross number undervalued.
How do you measure customer profitability without perfect data?
Start with a cohort instead of the whole file: compute net contribution for the top decile of customers by gross spend, using whatever return, claim, and dispute records you can join. Even a partial ledger reveals the divergence, and it builds the case for unifying the rest of the data.
Bringing It Together
LTV earned its place as the north-star metric of ecommerce, and nothing here argues against it. The argument is with what the number counts. A model that books revenue and ignores returns, claims, chargebacks, and service cost will keep steering loyalty budgets, policy decisions, and retention spend toward customers who look valuable and are not, while underrating the customers who quietly are.
The direction of the industry makes the correction urgent: returns near a sixth of retail sales, disputes driven by real customers, and margins too thin to subsidize the gap. Merchants who move to net contribution get an LTV their finance team trusts and a customer file that finally tells the truth in both directions.
Curious what your top customers look like after the post-purchase ledger comes out? Start with what goes into a customer risk profile, or explore the Wyllo platform for the connected view the math depends on.